Fig. 10
Download original image
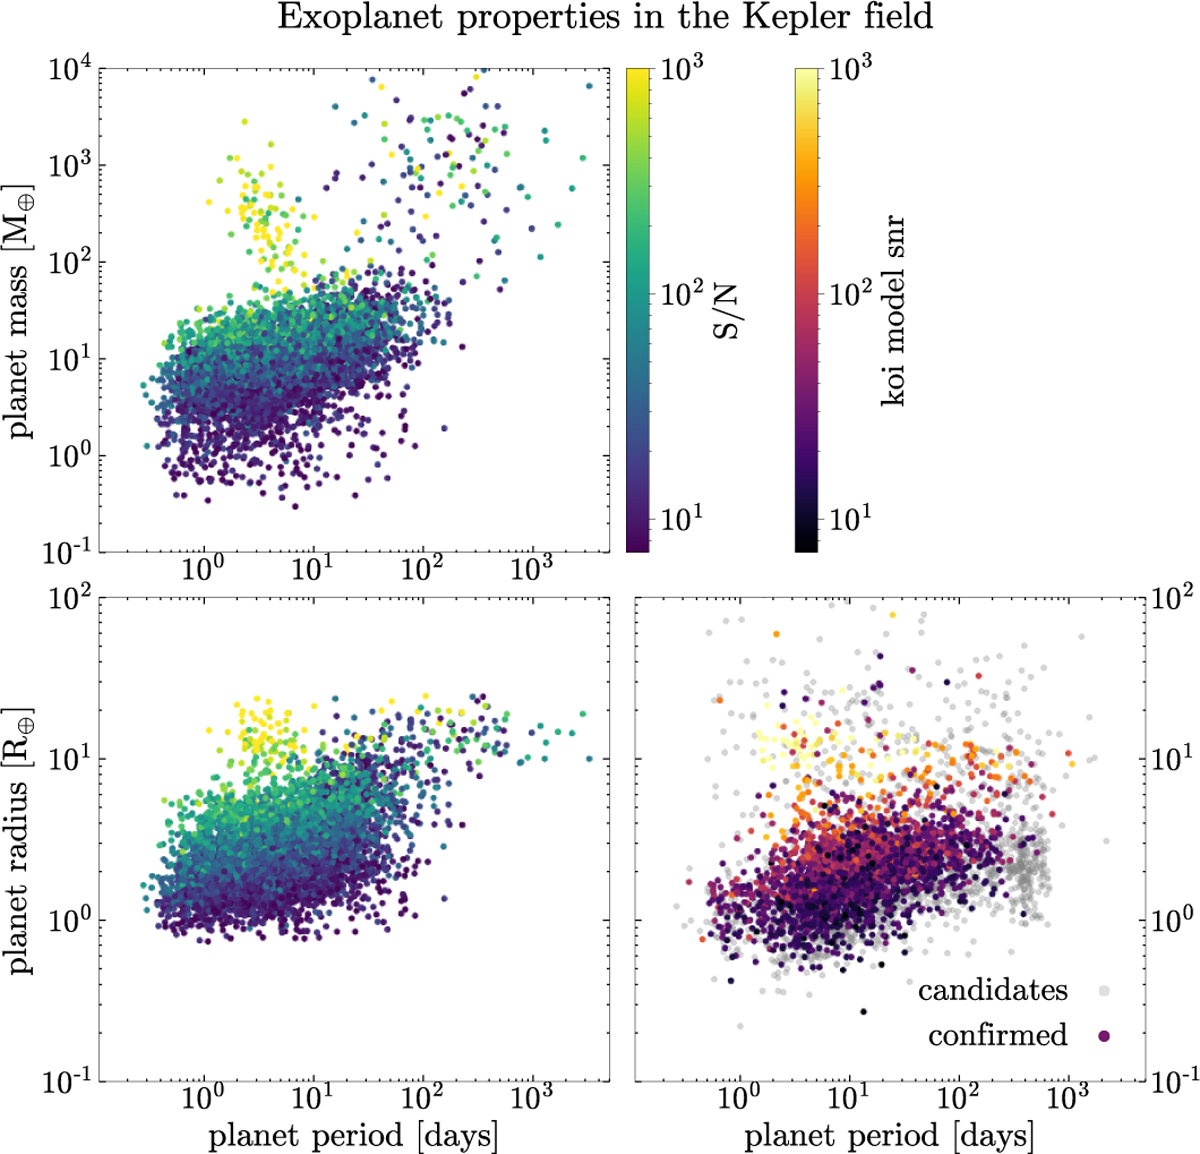
Comparison with exoplanets in the Kepler field (mass-period and radius-period diagrams). The left column shows the exoplanet population obtained by our simulation. The right plot shows the exoplanets found by Kepler (both candidates and confirmed). Top panel: planet mass (in M⊕) vs. orbital period (in days). Bottom row: planet radius (in R⊕) vs. period. For the simulated exoplanets, the radius was obtained with a conversion from the planet mass (see Appendix B).
Current usage metrics show cumulative count of Article Views (full-text article views including HTML views, PDF and ePub downloads, according to the available data) and Abstracts Views on Vision4Press platform.
Data correspond to usage on the plateform after 2015. The current usage metrics is available 48-96 hours after online publication and is updated daily on week days.
Initial download of the metrics may take a while.