Fig. 3
Download original image
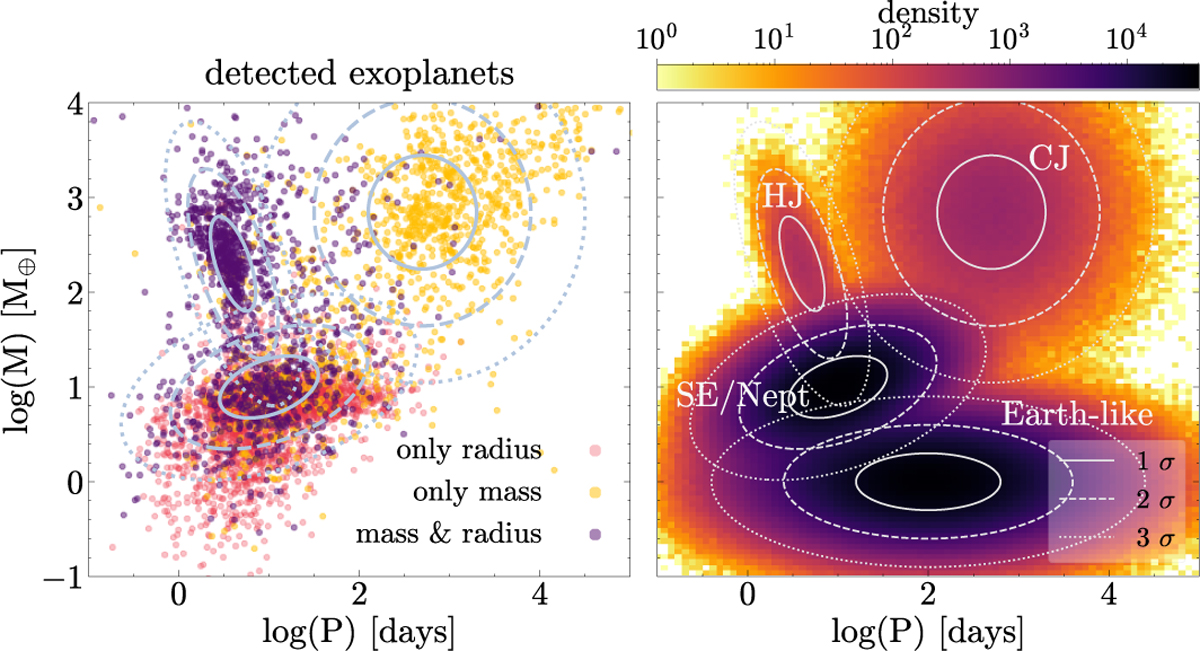
Distribution of detected vs. simulated exoplanets. Left panel: detected exoplanets from the NASA Exoplanet Archive. Planets with both mass and radius measurements are shown in purple, and the ones with only mass measurements are in yellow. Planets with only radius measurement are in red (using the radius-to-mass conversions of Parc et al. 2024), but were not used to derive the bivariate Gaussian distributions. Right panel: density distribution (number count per pixel) of the 24.5 million simulated exoplanets in the solar vicinity. In grey lines are overplotted the bivariate Gaussian distributions used to assign a mass and a period to each planet randomly. The distribution of giants (HJ and CJ) and SE & Neptunes were chosen to reproduce the confirmed exoplanet population (see left panel) while the Earth-like distribution was based on the distribution predicted by (Drążkowska et al. 2023, their Fig. 13).
Current usage metrics show cumulative count of Article Views (full-text article views including HTML views, PDF and ePub downloads, according to the available data) and Abstracts Views on Vision4Press platform.
Data correspond to usage on the plateform after 2015. The current usage metrics is available 48-96 hours after online publication and is updated daily on week days.
Initial download of the metrics may take a while.