Fig. 5
Download original image
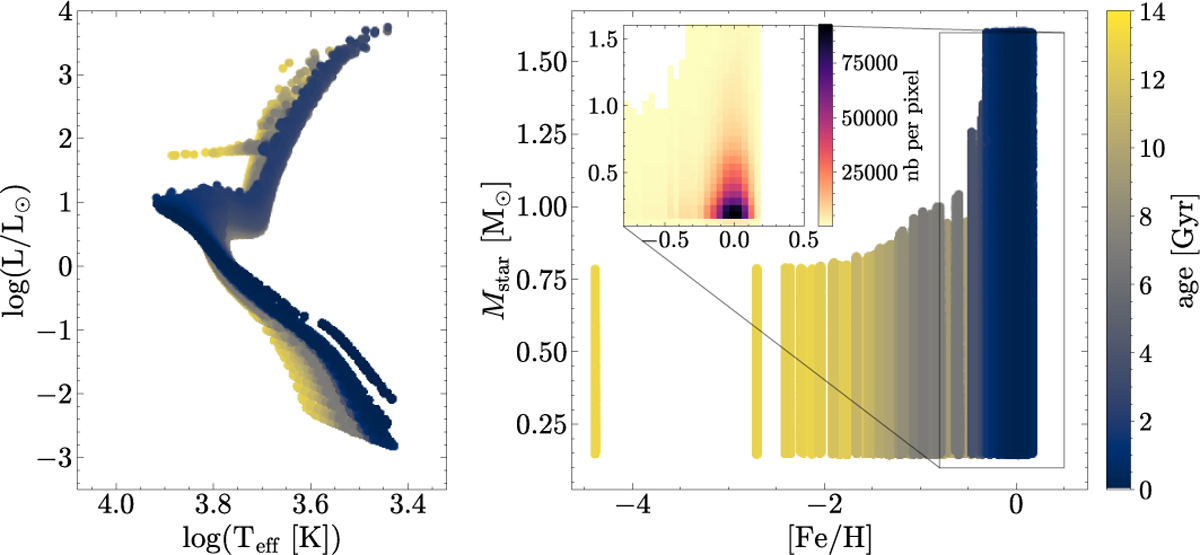
All simulated stars in the volume-complete SN of the g7.55e11 galactic simulation. Left panel shows the Hertzsprung-Russell diagram, colour coded by age. Right panel shows the distribution of stellar mass versus metallicity, also colour coded by age. The zoom-in panel shows the density distribution of stars in the region of the mass-metallicity space plotted in Fig. 2.
Current usage metrics show cumulative count of Article Views (full-text article views including HTML views, PDF and ePub downloads, according to the available data) and Abstracts Views on Vision4Press platform.
Data correspond to usage on the plateform after 2015. The current usage metrics is available 48-96 hours after online publication and is updated daily on week days.
Initial download of the metrics may take a while.