Fig. 6
Download original image
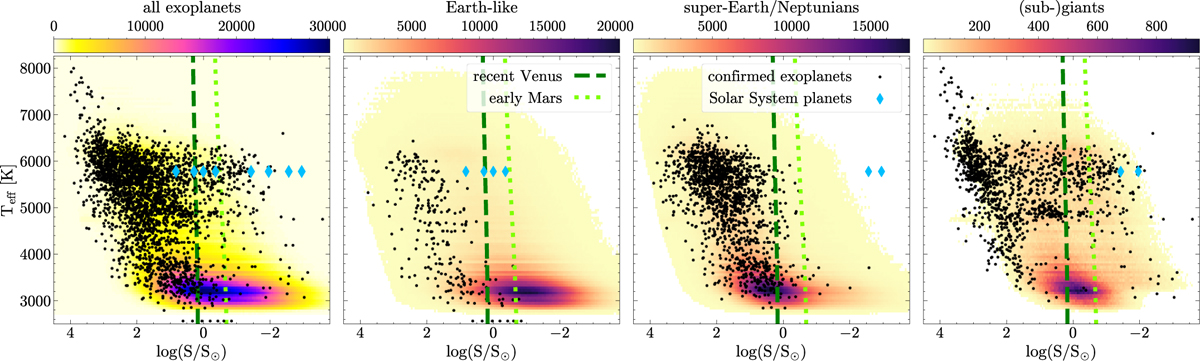
Effective temperature of the host stars vs. instellation at the simulated exoplanet for the volume-complete SN sample. For comparison, we overplot the distribution of the observed exoplanets (Christiansen et al. 2025) as black dots and the solar-system planets as cyan diamonds. The left panel shows the entire sample, while the other three panels show the distribution of each planet category (Earth-like, SE and Neptunians, giant planets). The limits we adopted for the definition of the CHZ are plotted in dark and light green (see Sect. 3.4).
Current usage metrics show cumulative count of Article Views (full-text article views including HTML views, PDF and ePub downloads, according to the available data) and Abstracts Views on Vision4Press platform.
Data correspond to usage on the plateform after 2015. The current usage metrics is available 48-96 hours after online publication and is updated daily on week days.
Initial download of the metrics may take a while.