Open Access
Fig. 2
Download original image
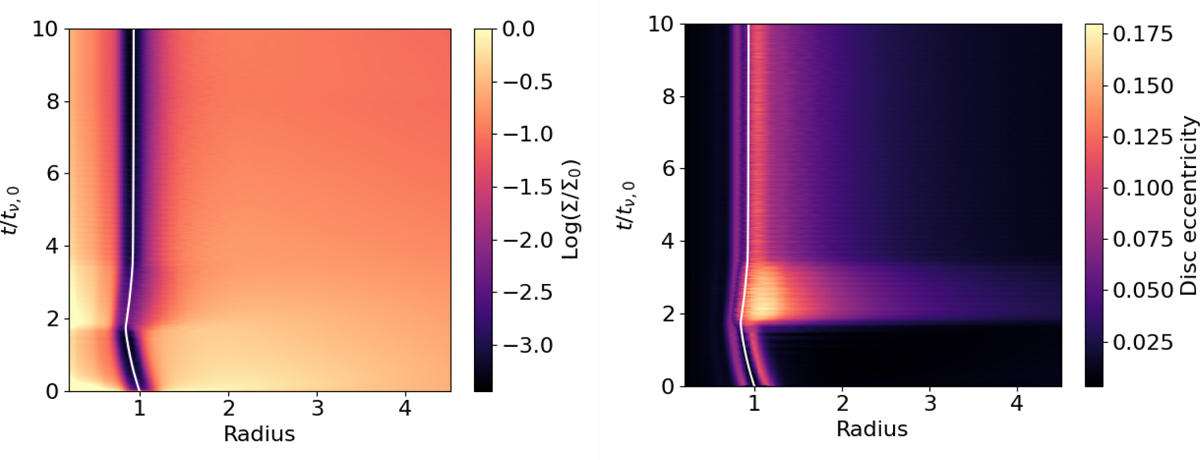
Simulation M-m1-h05. The color maps show the azimuthal average of the disk normalized density Σ/Σ0 (left panel) and of the disk eccentricity (right panel) as a function of the disk radius (x-axis) and of evolutionary time t/tν,0 (y-axis). The white line in both plots shows the planet migration track.
Current usage metrics show cumulative count of Article Views (full-text article views including HTML views, PDF and ePub downloads, according to the available data) and Abstracts Views on Vision4Press platform.
Data correspond to usage on the plateform after 2015. The current usage metrics is available 48-96 hours after online publication and is updated daily on week days.
Initial download of the metrics may take a while.