Fig. 3
Download original image
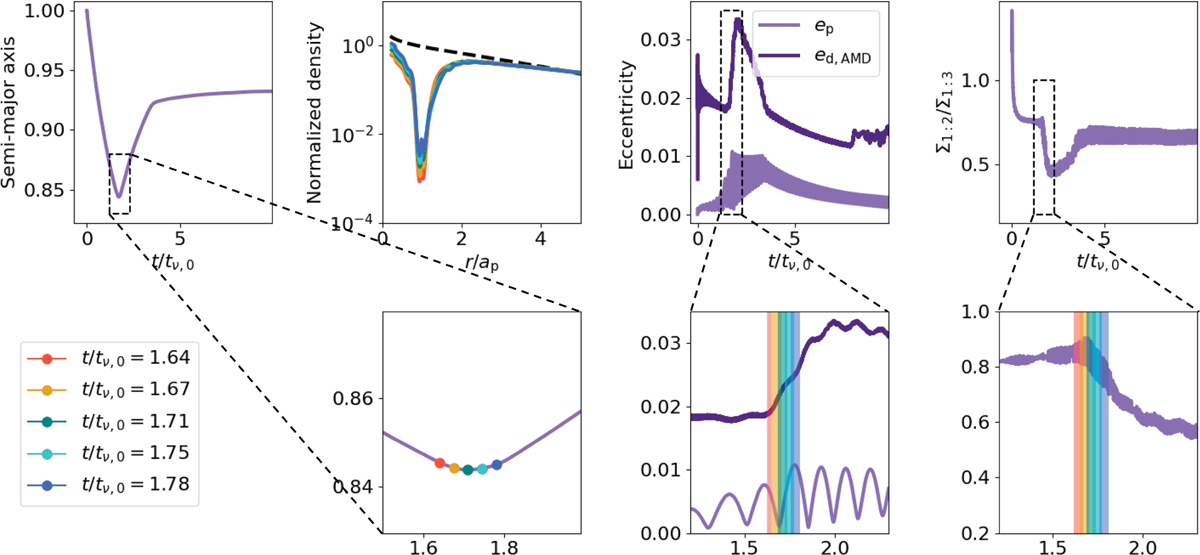
Analysis of the migration behavior in simulation M-m1-h05. The left panel shows the semimajor axis as a function of the evolutionary time, with a zoom in the region where the planet changes its direction of migration, marked via the green dot. The other colored dots mark selected snapshots just before and after the change in migration direction. The middle-left panel shows the density profiles at the selected snapshots. The middle-right panel shows the disk (dark purple) and planet eccentricity (medium purple) evolution. The colored regions highlight the selected snapshots. The plot in the right panel illustrates the density ratio at the 1:2 and 1:3 resonances.
Current usage metrics show cumulative count of Article Views (full-text article views including HTML views, PDF and ePub downloads, according to the available data) and Abstracts Views on Vision4Press platform.
Data correspond to usage on the plateform after 2015. The current usage metrics is available 48-96 hours after online publication and is updated daily on week days.
Initial download of the metrics may take a while.