Fig. 4
Download original image
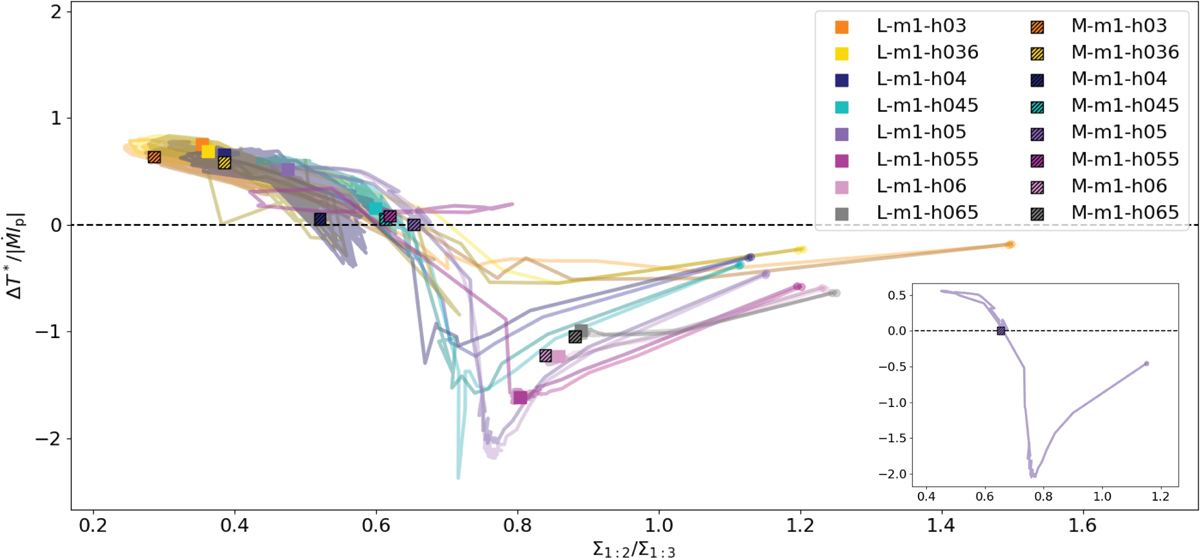
Portion of the normalized torque responsible for the change in the semimajor axis as a function of the density ratio at the 1:2 and 1:3 resonances Σ1:2/Σ1:3. Different colors indicate different disk aspect ratios at 5 au, as indicated in the legend. Markers indicate the state of each simulation at t = 10 tν. The lines show the evolution of each simulation, whose start is shown by the circles. The inset shows the evolution track for the simulation M-m1-h05. The high (low) line opacity corresponds to the lower (higher) disk mass regimes.
Current usage metrics show cumulative count of Article Views (full-text article views including HTML views, PDF and ePub downloads, according to the available data) and Abstracts Views on Vision4Press platform.
Data correspond to usage on the plateform after 2015. The current usage metrics is available 48-96 hours after online publication and is updated daily on week days.
Initial download of the metrics may take a while.