Fig. 3
Download original image
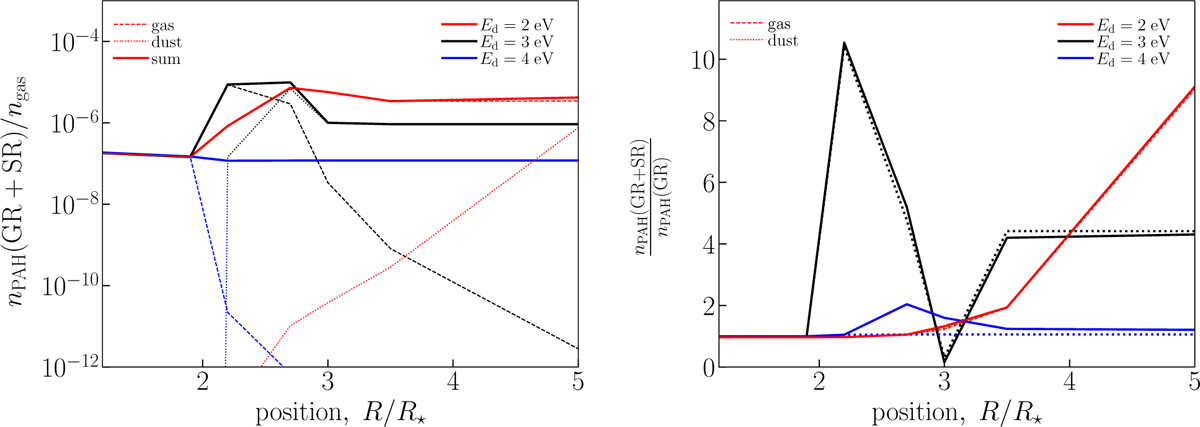
Left: total abundance of all aromatic molecules obtained in the model with CTM. Gas-phase abundances are shown by dashed lines, solid-phase abundances are shown by dotted lines, and the sum abundance is shown by solid lines. Red, black, and blue colors illustrate the models with Ed = 2, 3 and 4 eV, respectively. Right: ratio between the total abundance of all aromatic molecules obtained in the models with the surface acetylene CTM and without it. The designation “GR+SR” means the model with CTM, while the designation “GR” indicates the model without it. The ratio of gas-phase abundances is illustrated by solid lines, while the ratio of solid-phase abundances is shown by dotted lines. The colors correspond to the same models as in the left panel.
Current usage metrics show cumulative count of Article Views (full-text article views including HTML views, PDF and ePub downloads, according to the available data) and Abstracts Views on Vision4Press platform.
Data correspond to usage on the plateform after 2015. The current usage metrics is available 48-96 hours after online publication and is updated daily on week days.
Initial download of the metrics may take a while.