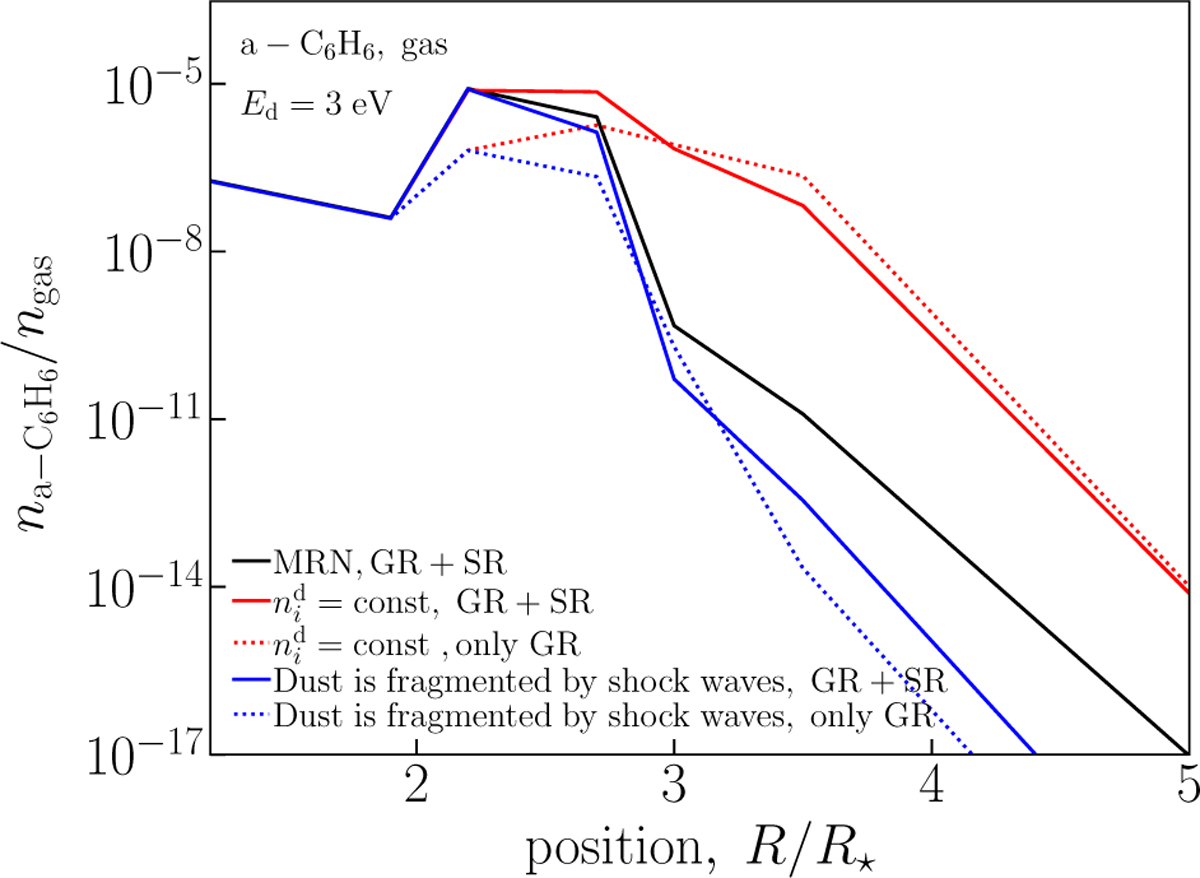
Fig. B.1
Download original image
Gas-phase benzene abundances at various distances from the star. The black solid line is the result of the “standard” model with CMT (Fig. 1). The red solid and dotted lines illustrate the results obtained for the uniform initial size distribution. The blue solid and dashed lines correspond to the cases when dust grains fragment back to the initial size distribution (MRN) at the start of each shock wave.
Current usage metrics show cumulative count of Article Views (full-text article views including HTML views, PDF and ePub downloads, according to the available data) and Abstracts Views on Vision4Press platform.
Data correspond to usage on the plateform after 2015. The current usage metrics is available 48-96 hours after online publication and is updated daily on week days.
Initial download of the metrics may take a while.