Fig. 4
Download original image
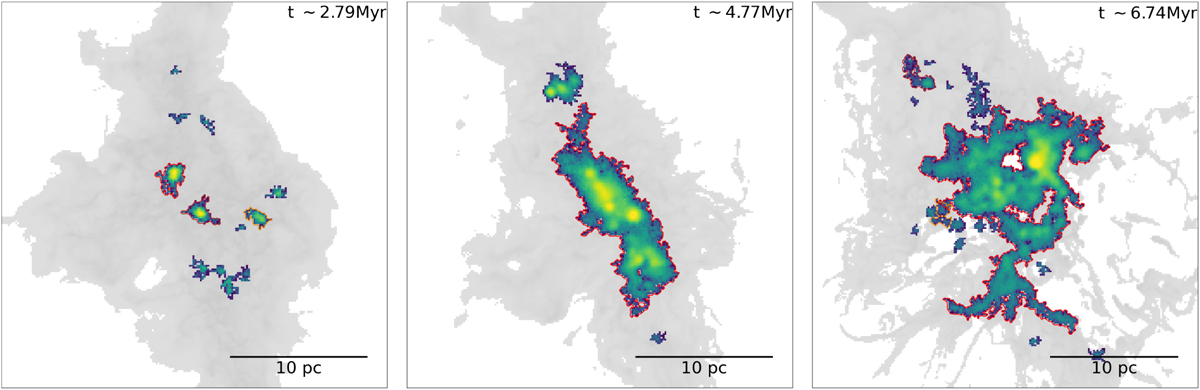
Moment 0 maps of 13CO(2–1) at different evolutionary times. The background grey scale represents the H2 gas density with 13CO(2–1) emission overlaid as viridis maps (molecular gas complex), and the coloured contours represent different MCs (dendrogram trunks), with red contours representing the largest MCs (R) in the cube. The 13CO(2–1) maps for multiple snapshots along different projections are presented in Appendix B.
Current usage metrics show cumulative count of Article Views (full-text article views including HTML views, PDF and ePub downloads, according to the available data) and Abstracts Views on Vision4Press platform.
Data correspond to usage on the plateform after 2015. The current usage metrics is available 48-96 hours after online publication and is updated daily on week days.
Initial download of the metrics may take a while.