Fig. 8
Download original image
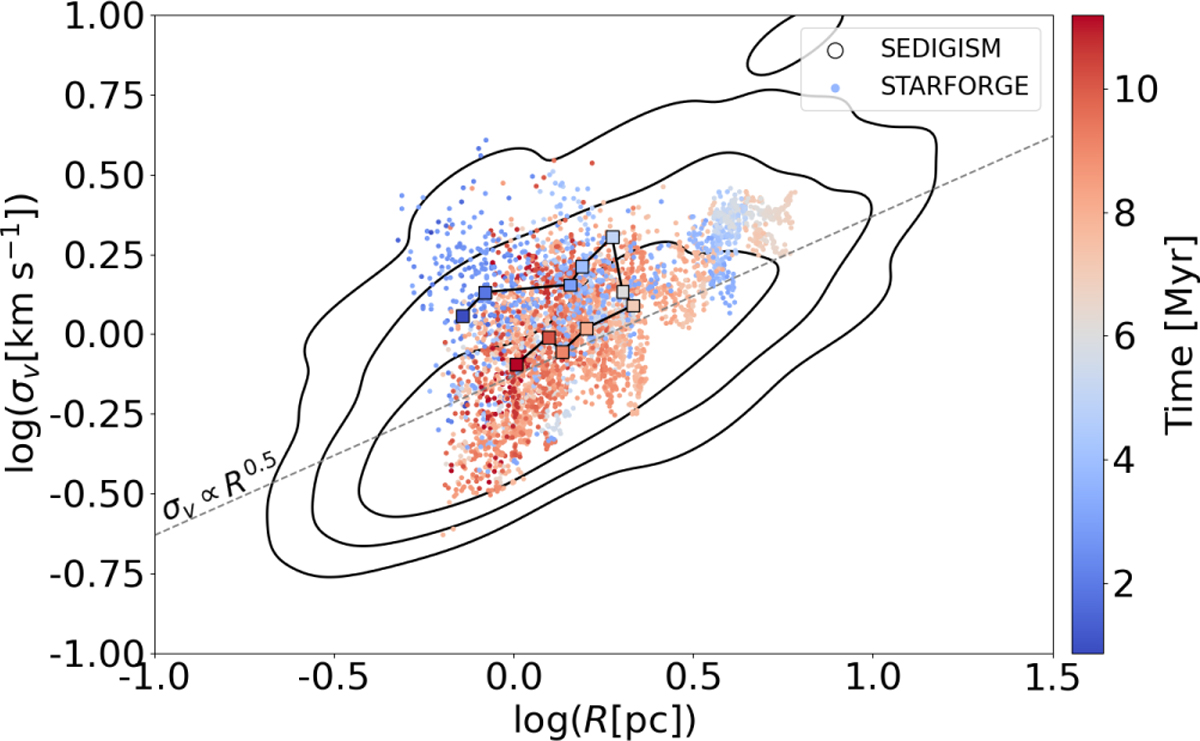
Size-linewidth relation (σv versus R) for our MCs (scatter points), colour-coded with respect to the time elapsed (in Myr) since the start of the simulation. The squares represent medians of distributions in ~1 Myr bins. The black contours represent the 1σ, 2σ, 3σ levels for the SEDIGISM clouds. The dashed line represents Larson’s first relation (Larson 1981; Solomon et al. 1987).
Current usage metrics show cumulative count of Article Views (full-text article views including HTML views, PDF and ePub downloads, according to the available data) and Abstracts Views on Vision4Press platform.
Data correspond to usage on the plateform after 2015. The current usage metrics is available 48-96 hours after online publication and is updated daily on week days.
Initial download of the metrics may take a while.