Open Access
Fig. 9
Download original image
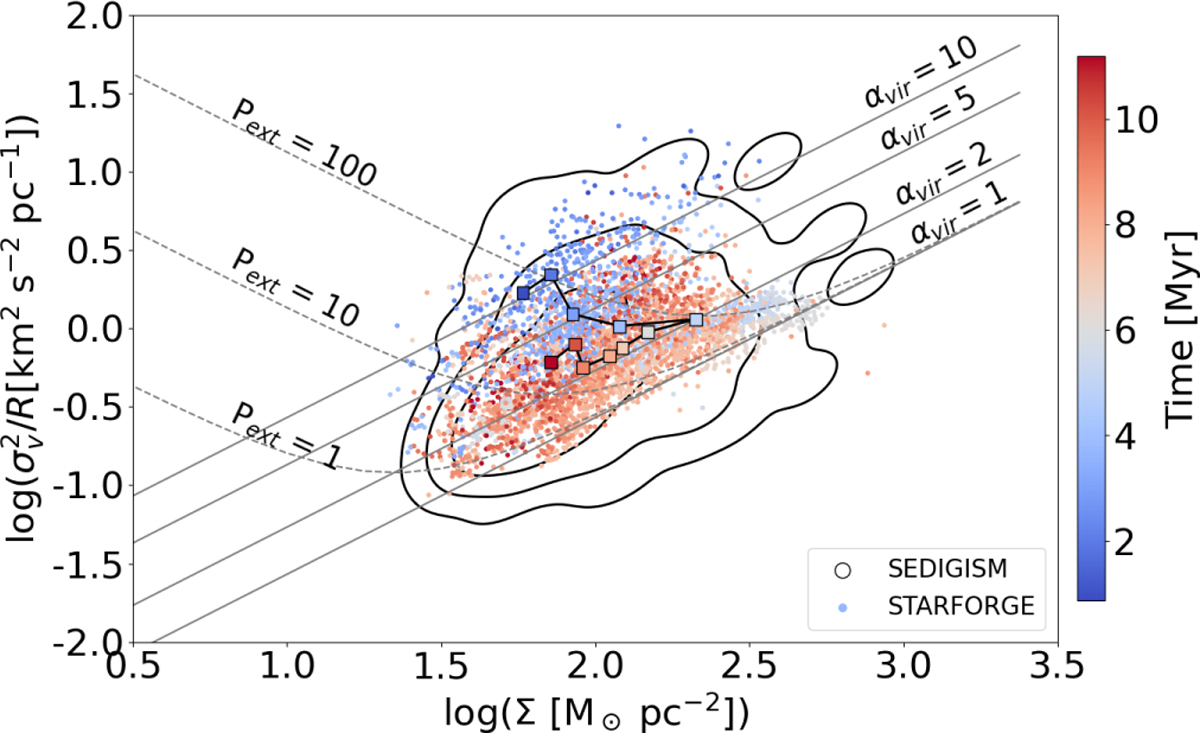
Scaling relation between ![]() and surface mass density (Σ). The symbols and notations follow Fig. 8. The solid grey lines represent isocontours of virial parameters. The dashed lines represent αvir = 1 when including an external pressure of Pext = 1, 10, and 100 M⊙ pc−3 km2 s−2.
and surface mass density (Σ). The symbols and notations follow Fig. 8. The solid grey lines represent isocontours of virial parameters. The dashed lines represent αvir = 1 when including an external pressure of Pext = 1, 10, and 100 M⊙ pc−3 km2 s−2.
Current usage metrics show cumulative count of Article Views (full-text article views including HTML views, PDF and ePub downloads, according to the available data) and Abstracts Views on Vision4Press platform.
Data correspond to usage on the plateform after 2015. The current usage metrics is available 48-96 hours after online publication and is updated daily on week days.
Initial download of the metrics may take a while.