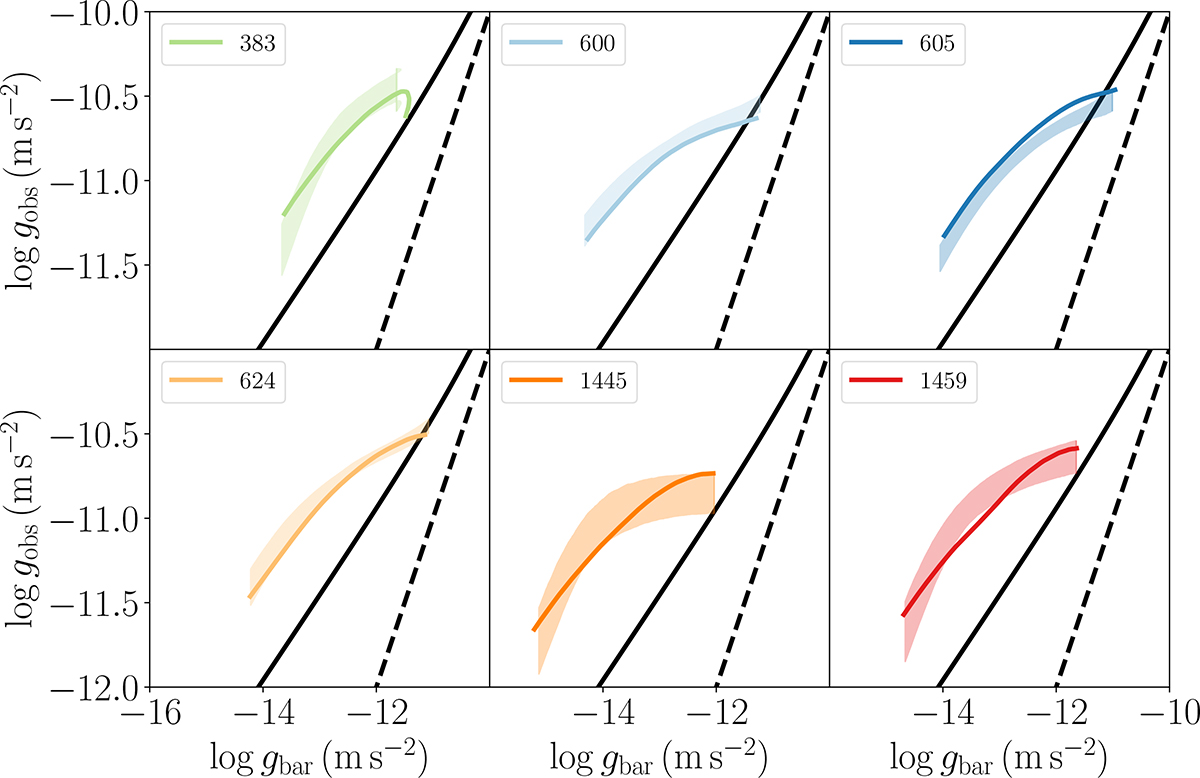
Fig. 2.
Download original image
Test of our recovery of RAR by applying GRAVSPHERE to mock data drawn from simulated EDGE dwarfs. For this test, we used all of the simulated star particles to fit the photometric light profile and a random 1000 stars to measure the line-of-sight velocity dispersion profile (similar to our more poorly sampled observed dwarfs; see Table 1). The shaded band marks the 68% confidence intervals. The true answer (as determined directly from the simulations, using Equations (1) and (2), assuming spherical symmetry) is marked by the solid lines. The solid black line marks the RAR derived by McGaugh et al. (2016) for SPARC local spiral galaxies. The dashed black line marks gobs = gbar.
Current usage metrics show cumulative count of Article Views (full-text article views including HTML views, PDF and ePub downloads, according to the available data) and Abstracts Views on Vision4Press platform.
Data correspond to usage on the plateform after 2015. The current usage metrics is available 48-96 hours after online publication and is updated daily on week days.
Initial download of the metrics may take a while.