Fig. 5.
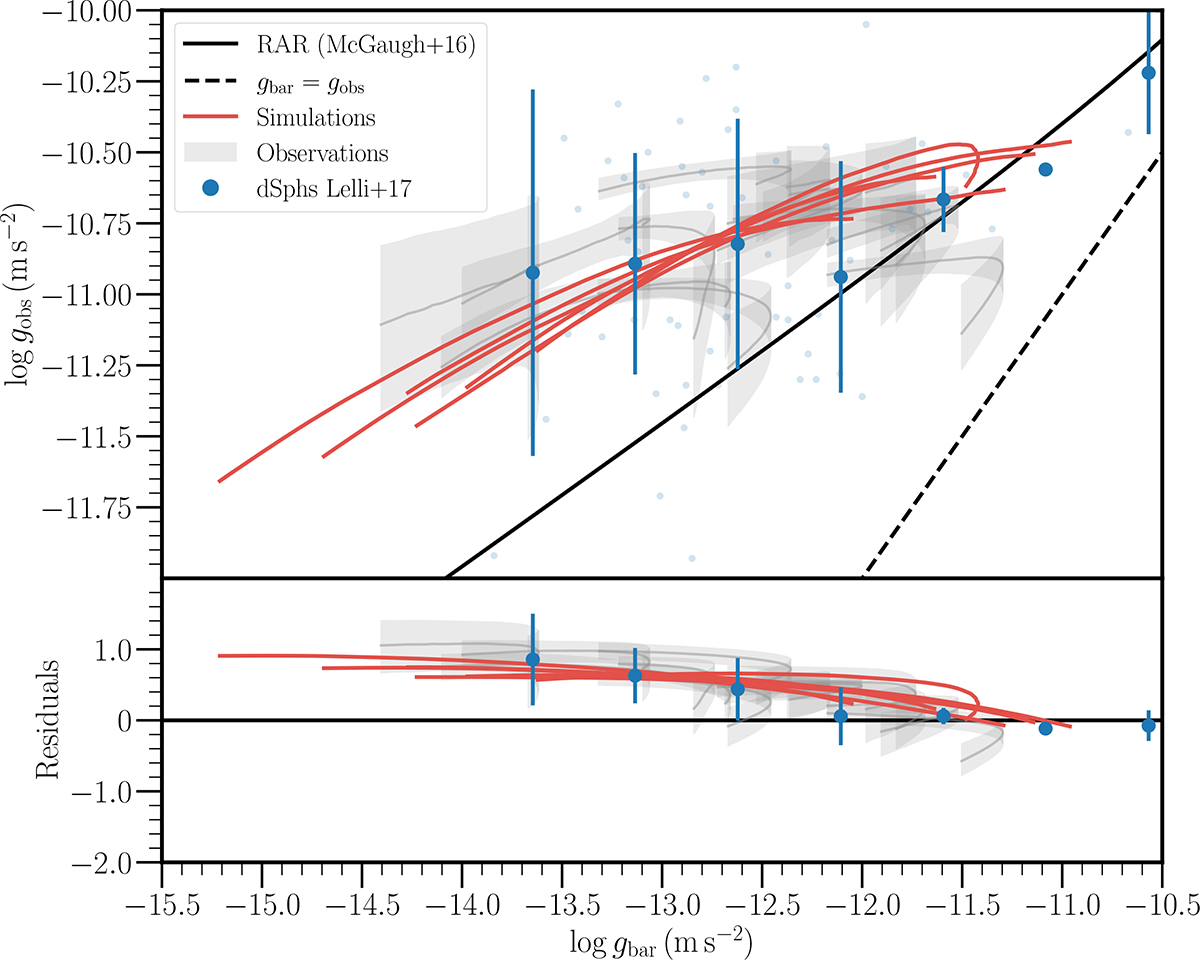
Download original image
Quantitative comparison of the EDGE simulated RAR with our observed dwarf galaxy sample. The black solid line corresponds to the RAR derived by McGaugh et al. (2016) for SPARC local spiral galaxies. The median and 68% scatter in the observed gobs − gbar relations are marked by the grey solid lines and shaded regions, respectively. The gobs − gbar relations estimated directly from the simulations are represented by solid red lines. The blacked dashed line marks gobs = gbar. The small blue points mark the positions of the dSphs on this relation Lelli et al. (2017), while the blue circles indicate the mean and 1σ scatter of the binned data. At the bottom, the residuals relative to the McGaugh et al. (2016) relation (black solid line) are represented for the observed, the simulated, and the Lelli et al. (2017) data.
Current usage metrics show cumulative count of Article Views (full-text article views including HTML views, PDF and ePub downloads, according to the available data) and Abstracts Views on Vision4Press platform.
Data correspond to usage on the plateform after 2015. The current usage metrics is available 48-96 hours after online publication and is updated daily on week days.
Initial download of the metrics may take a while.