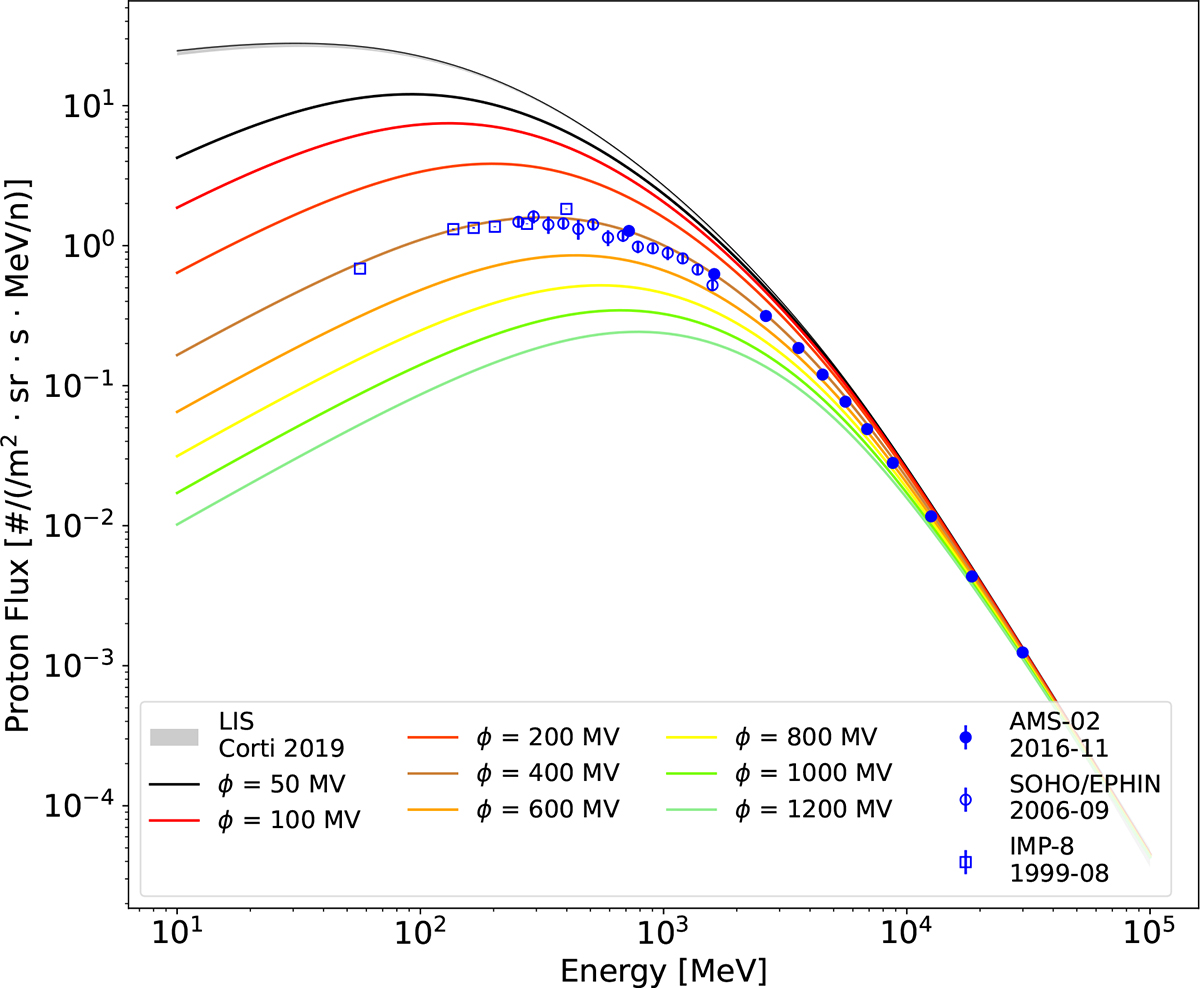
Fig. 2.
Download original image
LIS and modulated GCR spectra derived from the force-field approximation. The LIS from Corti et al. (2019b) is shown as a thin black line, with the shaded gray area representing the uncertainty range encompassing three standard deviations. The thick colored lines represent the GCR spectra near 1 AU, calculated using the force-field approximation under different solar modulation potentials. Markers indicate measurements from AMS-02, SOHO/EPHIN, and IMP-8 during different time periods with very similar modulation conditions. In some cases (particularly IMP-8 and AMS-02) vertical bars showing the measurement uncertainties are too small to be seen. The data point with the lowest energy for IMP8 originates from CRNC; it is included in this figure solely for display purposes and is not used in this study. More information about the observational data is listed in Table 1.
Current usage metrics show cumulative count of Article Views (full-text article views including HTML views, PDF and ePub downloads, according to the available data) and Abstracts Views on Vision4Press platform.
Data correspond to usage on the plateform after 2015. The current usage metrics is available 48-96 hours after online publication and is updated daily on week days.
Initial download of the metrics may take a while.