Fig. 3.
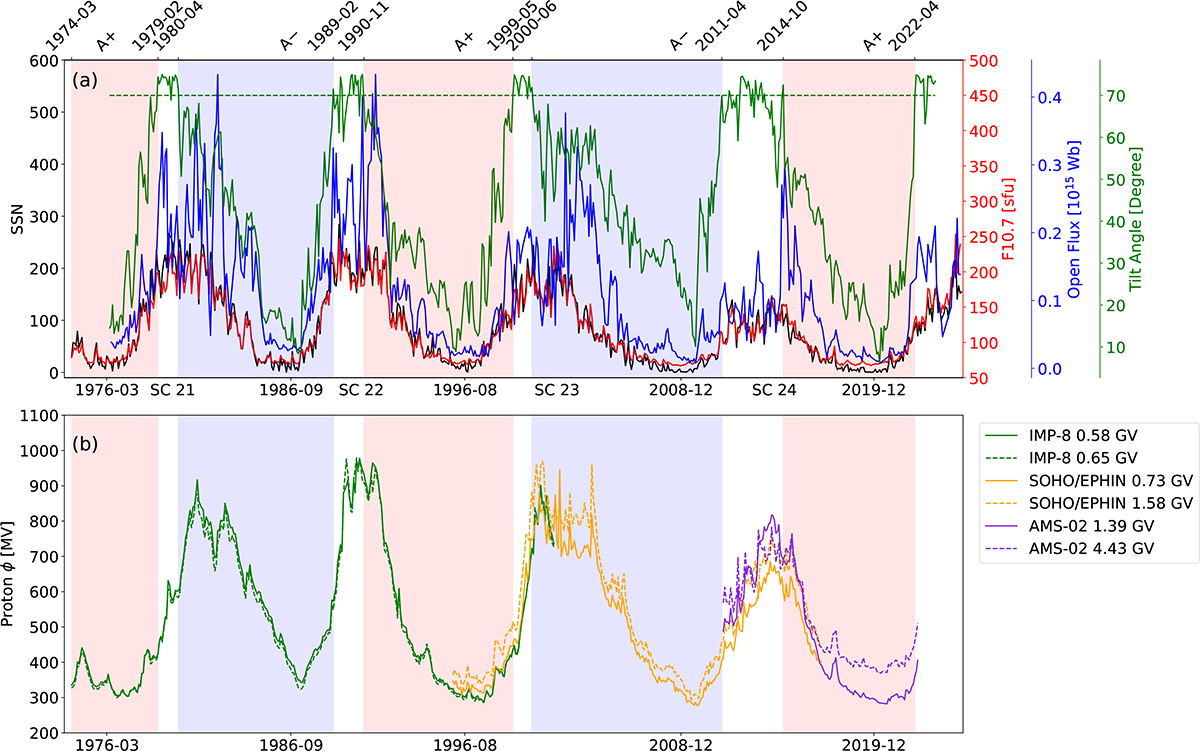
Download original image
Time evolution of various solar activity indices and derived modulation potential, ϕ, from 1976 to 2022. Panel (a) shows the time profile of monthly solar activity indices, with the SSN, F10.7, and OF represented by solid black, red, and blue lines, respectively. The lower x axis includes solar minimum dates and solar cycle number (solar cycles are separated by gray solid lines). The shaded red and blue areas indicate the periods when the inclination of the heliospheric current sheet (indicated by the tilt angle, solid green line) is less than 70°. The start and end period of each shaded area, along with the corresponding polarity of the heliospheric magnetic field, are marked on the upper x axis. The F10.7 index is plotted in solar flux units (sfu, 1 sfu = 10−22 W m−2 Hz−1). Panel (b) shows the time profile of monthly GCR modulation, ϕ, for protons with different rigidities, derived by measurements of IMP-8, SOHO/EPHIN, and AMS-02, as shown in the legend.
Current usage metrics show cumulative count of Article Views (full-text article views including HTML views, PDF and ePub downloads, according to the available data) and Abstracts Views on Vision4Press platform.
Data correspond to usage on the plateform after 2015. The current usage metrics is available 48-96 hours after online publication and is updated daily on week days.
Initial download of the metrics may take a while.