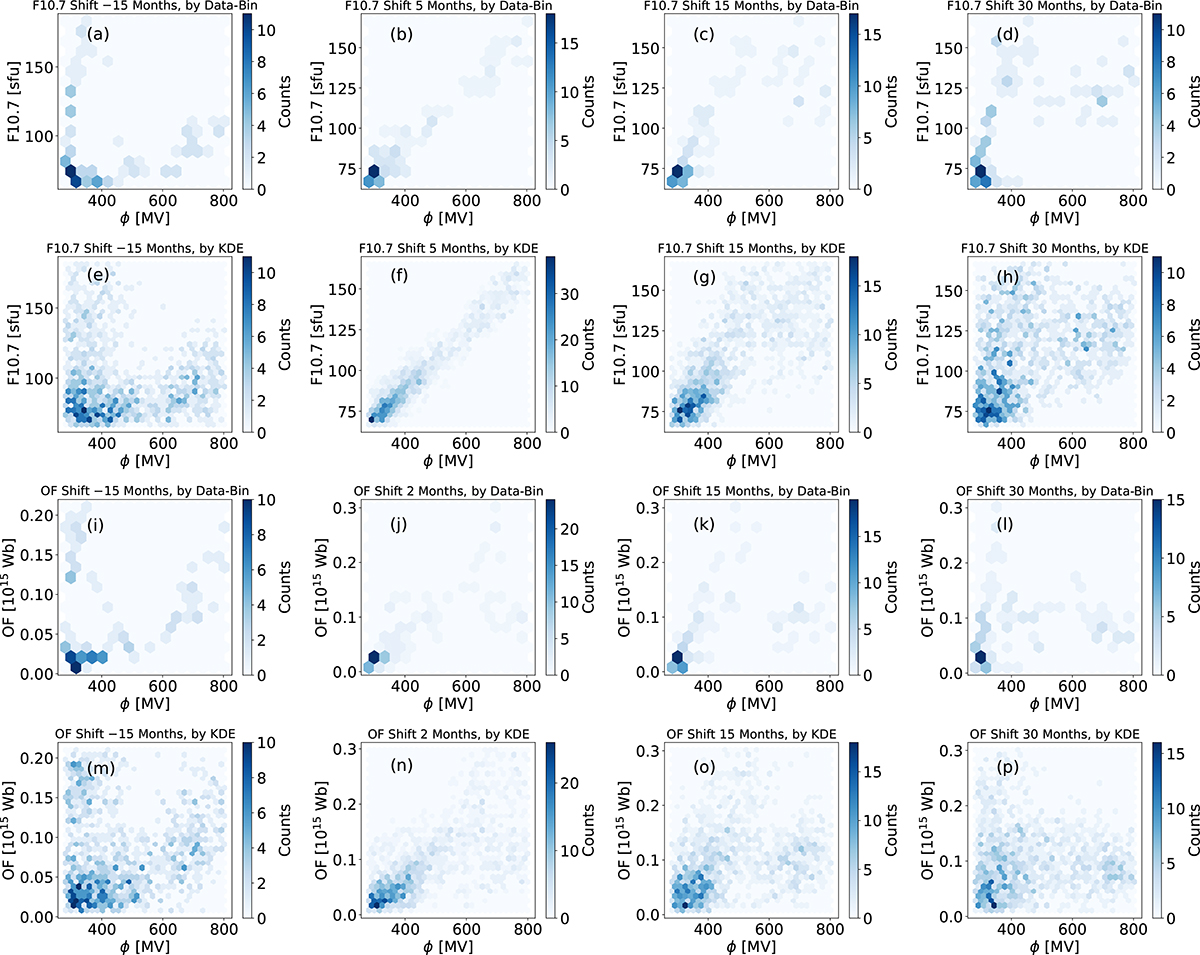
Fig. 4.
Download original image
Examples of the joint probability distribution between the modulation potential, ϕ(R), for protons (1.00–1.92 GV, AMS-02 data) and solar activity indices including F10.7 (first and second rows) and OF (third and fourth rows) spanning from April 2014 to May 2022. The first and third rows show results obtained using the data-bin method, while the second and fourth rows are obtained by the KDE method. For each method, we fixed ϕ(R) and shifted the solar activity index, with positive values (month) representing shifts to the past while negative values representing shifts to the future. The shift time is, from left to right, −15, 5, 15, and 30 months for F10.7 (upper two rows) and −15, 2, 15, and 30 months for OF (lower two rows). In the second column, mutual information reaches its peak when offset by 5 months in F10.7 and by 2 months in OF relative to ϕ, thereby defining the delay time.
Current usage metrics show cumulative count of Article Views (full-text article views including HTML views, PDF and ePub downloads, according to the available data) and Abstracts Views on Vision4Press platform.
Data correspond to usage on the plateform after 2015. The current usage metrics is available 48-96 hours after online publication and is updated daily on week days.
Initial download of the metrics may take a while.