Open Access
Fig. 5.
Download original image
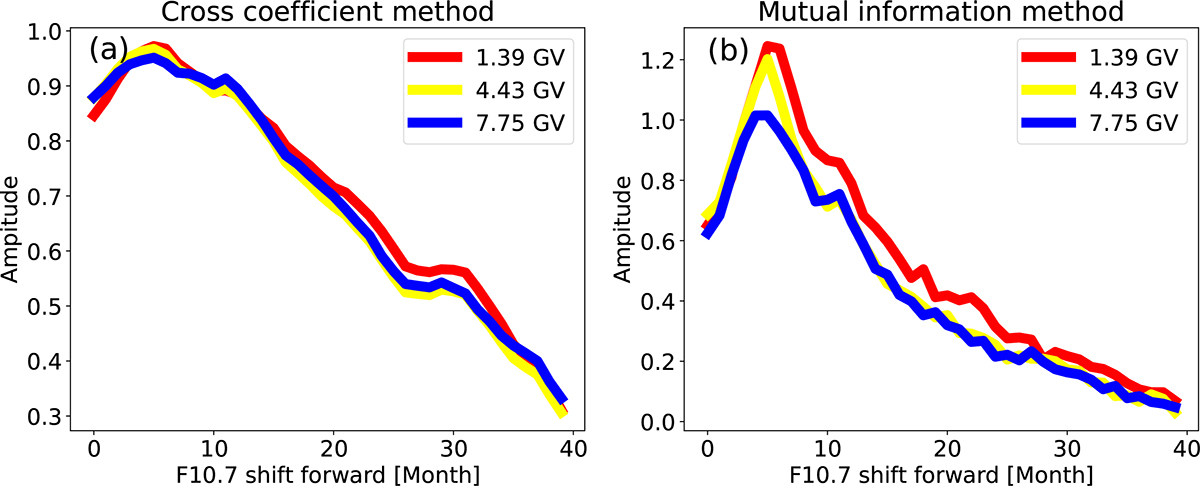
Comparison of two methods of determining delay time. Panel (a) shows the cross-correlation coefficient by shifting F10.7 index to the future with AMS-02 proton data fixed. Panel (b) is the same with panel (a) but using mutual information method based on Eq. (15).
Current usage metrics show cumulative count of Article Views (full-text article views including HTML views, PDF and ePub downloads, according to the available data) and Abstracts Views on Vision4Press platform.
Data correspond to usage on the plateform after 2015. The current usage metrics is available 48-96 hours after online publication and is updated daily on week days.
Initial download of the metrics may take a while.