Fig. 7.
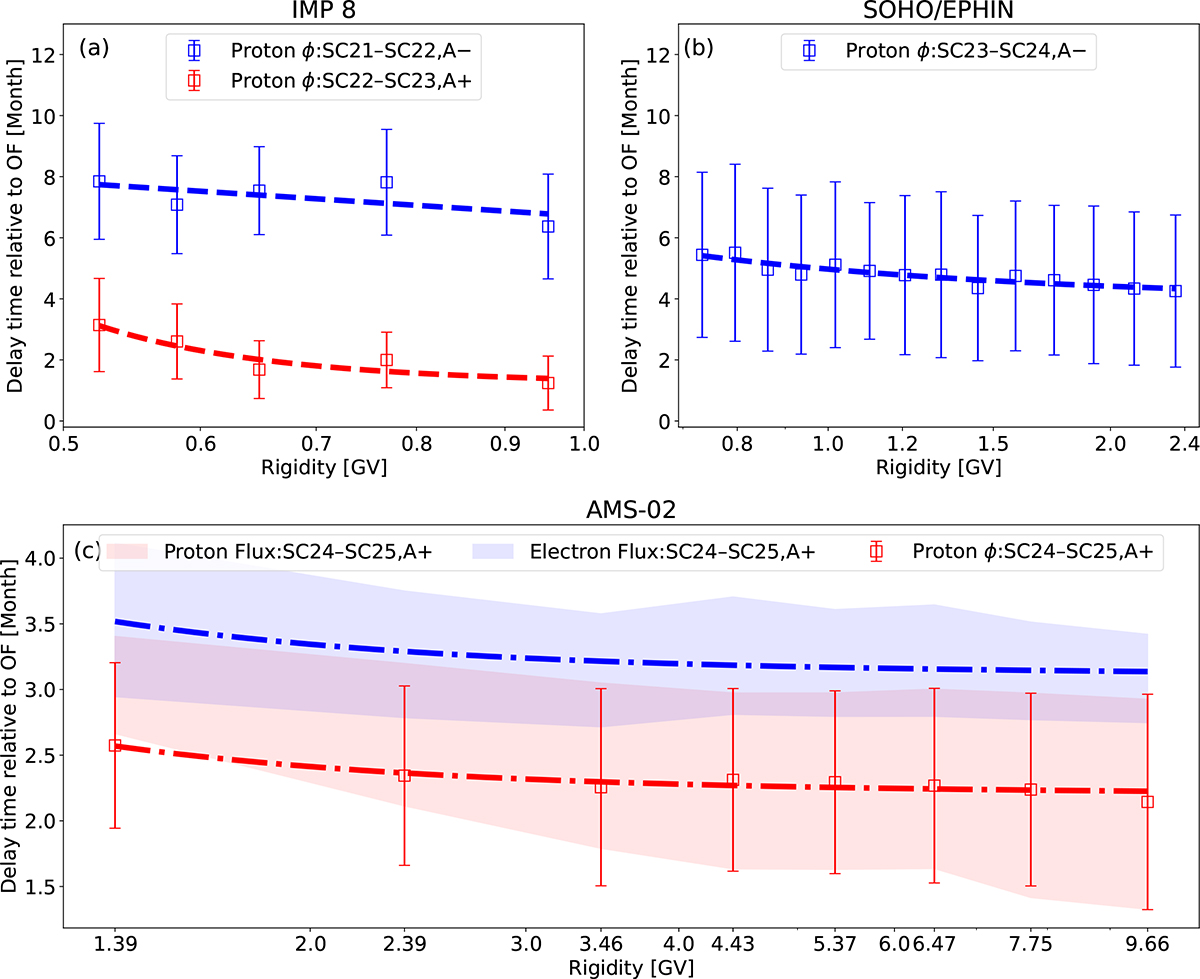
Download original image
Delay time of GCR modulation with respect to the OF, derived using mutual information, for protons measured by IMP-8, SOHO/EPHIN, AMS-02 and electrons measured by AMS-02 in different time periods (panels (a)–(c), respectively). The delay time and associated uncertainty derived from the modulation potential are shown with markers and error bars. The shaded red and blue areas in panel (c) represent the delay time derived directly from AMS-02 proton and electron data, respectively. The dashed lines in panels (a) and (b) and the dash-dotted lines in panel (c) are the fit delays obtained using the format of κR in Eq. (19), detailed in Sect. 5.2.
Current usage metrics show cumulative count of Article Views (full-text article views including HTML views, PDF and ePub downloads, according to the available data) and Abstracts Views on Vision4Press platform.
Data correspond to usage on the plateform after 2015. The current usage metrics is available 48-96 hours after online publication and is updated daily on week days.
Initial download of the metrics may take a while.