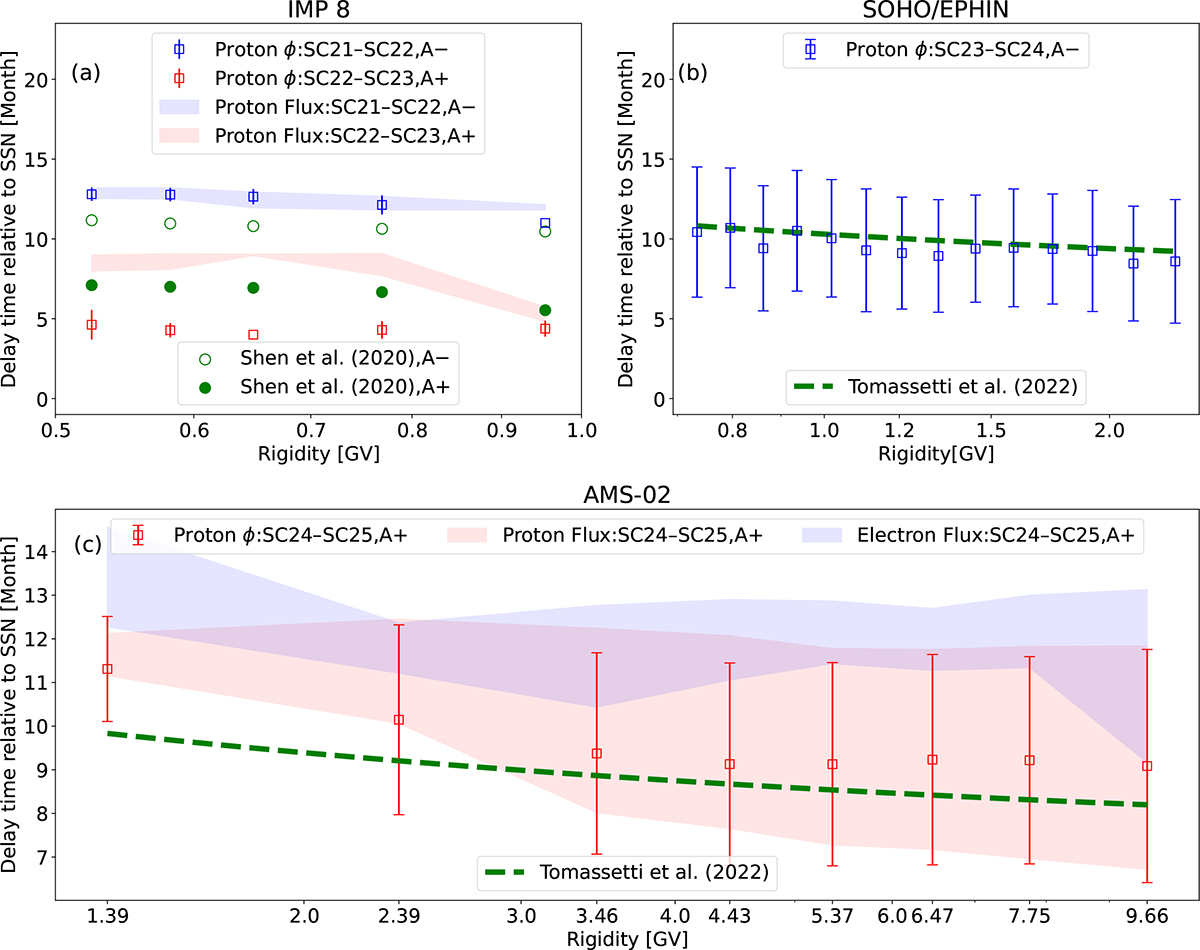
Fig. 8.
Download original image
Delay time of GCR modulation with respect to the SSN, derived using mutual information. The meaning of red and blue markers and shaded bands is the same as in Figure 7. We also include results from previous works by Shen et al. (2020), Tomassetti et al. (2022), shown as green markers and lines. To ensure consistency for comparison, the calculation window for determining delay time in panel (a) has been adjusted as follows: A < 0 covers June 1980 to September 1989, and A > 0 covers April 1991 to June 1999. The relatively small error bars in panel (a) result from the lower uncertainty of the IMP-8 data compared to the SOHO/EPHIN and AMS-02 data.
Current usage metrics show cumulative count of Article Views (full-text article views including HTML views, PDF and ePub downloads, according to the available data) and Abstracts Views on Vision4Press platform.
Data correspond to usage on the plateform after 2015. The current usage metrics is available 48-96 hours after online publication and is updated daily on week days.
Initial download of the metrics may take a while.