Fig. 11
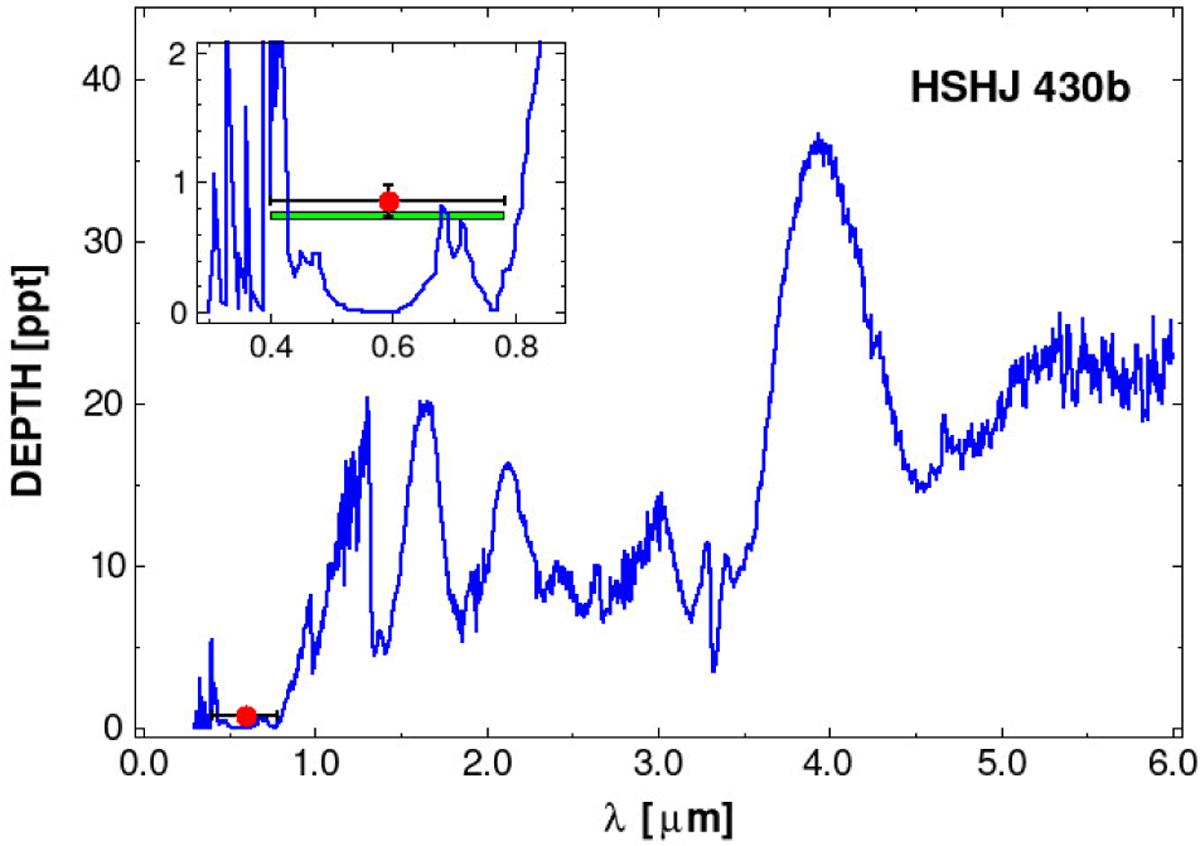
Download original image
As in Fig. 10 (same theoretical models and figure setting), but for EPIC 211946007b (HSHJ 430b). We used 100 K higher internal temperature (i.e., Tint = 1724 K) than the theoretical evolutionary value. The green horizontal bar in the inset shows the theoretical depth in the Kepler waveband, assuming 10% Bond albedo. Red dots with error bars show the observed depth.
Current usage metrics show cumulative count of Article Views (full-text article views including HTML views, PDF and ePub downloads, according to the available data) and Abstracts Views on Vision4Press platform.
Data correspond to usage on the plateform after 2015. The current usage metrics is available 48-96 hours after online publication and is updated daily on week days.
Initial download of the metrics may take a while.