Fig. 3
Download original image
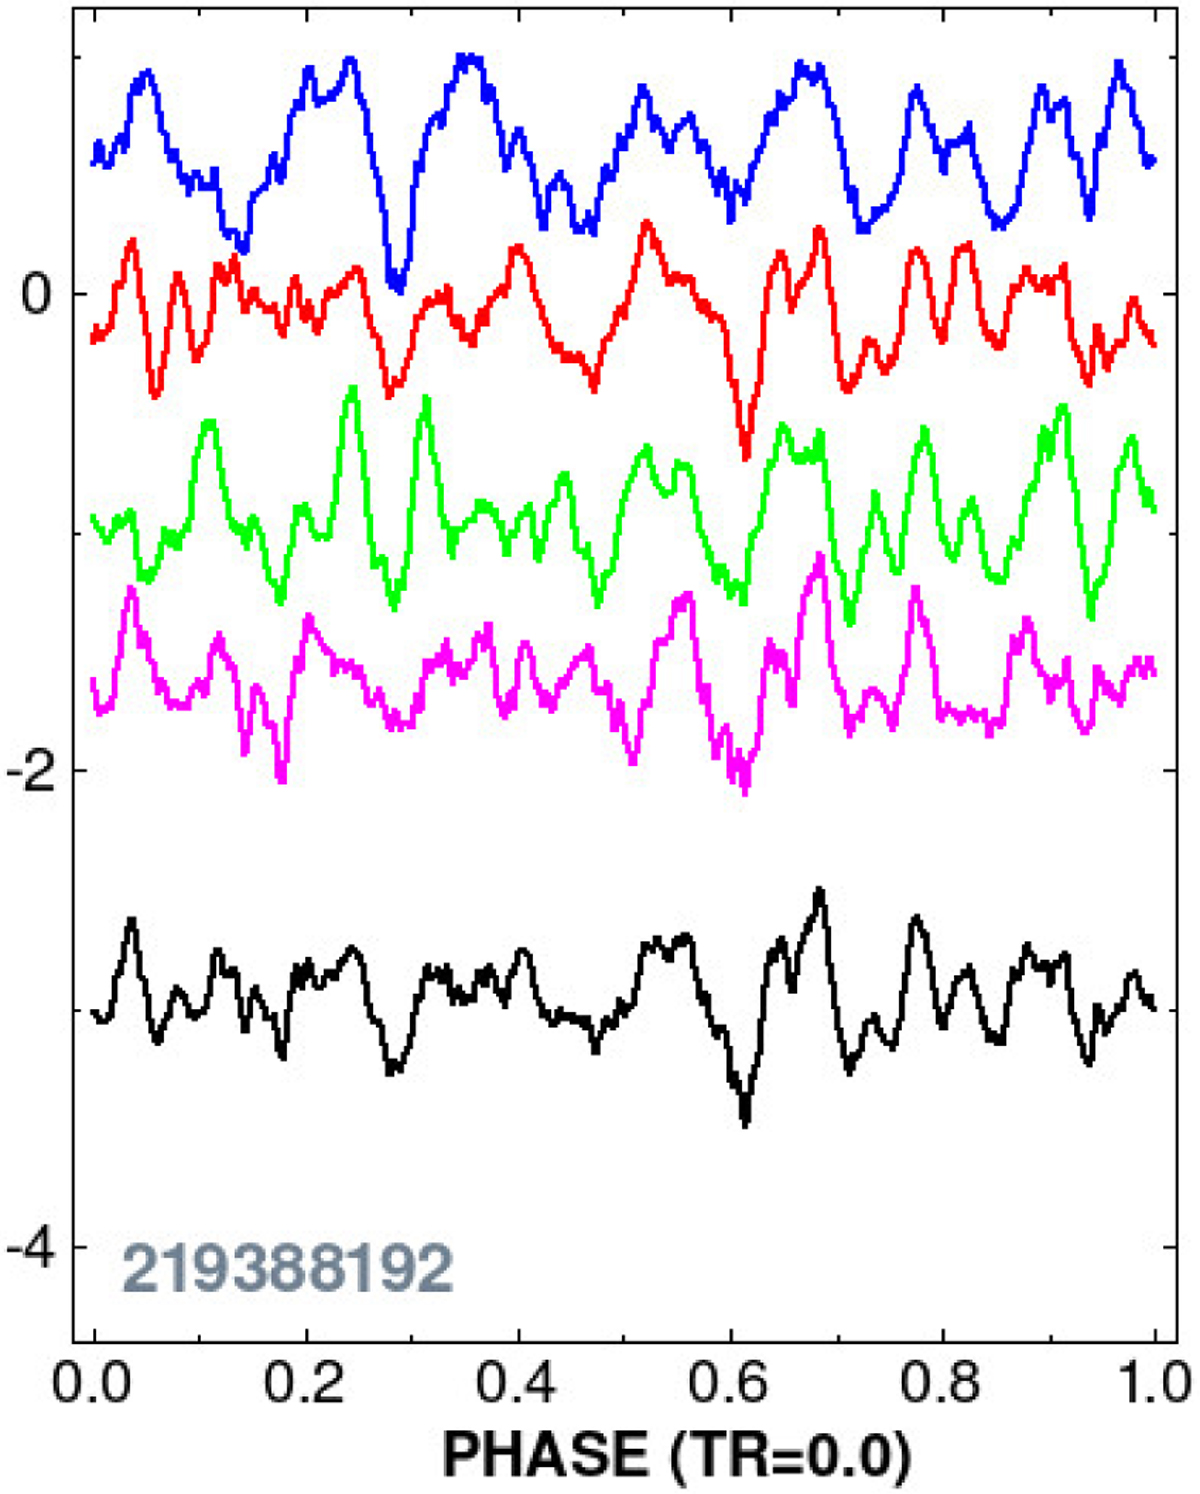
SES statistics for the non-reconstructed LCs of EPIC 219388192. From top to bottom, plotted are SES statistics derived on the data sources of LUG, KEP, PET and VAN. The averaged SES is shown by black at the bottom. The phase scan is made from the transit center (phase zero) throughout the full orbital phase. All curves are plotted on the same (but arbitrary) scale and shifted properly for good visibility.
Current usage metrics show cumulative count of Article Views (full-text article views including HTML views, PDF and ePub downloads, according to the available data) and Abstracts Views on Vision4Press platform.
Data correspond to usage on the plateform after 2015. The current usage metrics is available 48-96 hours after online publication and is updated daily on week days.
Initial download of the metrics may take a while.