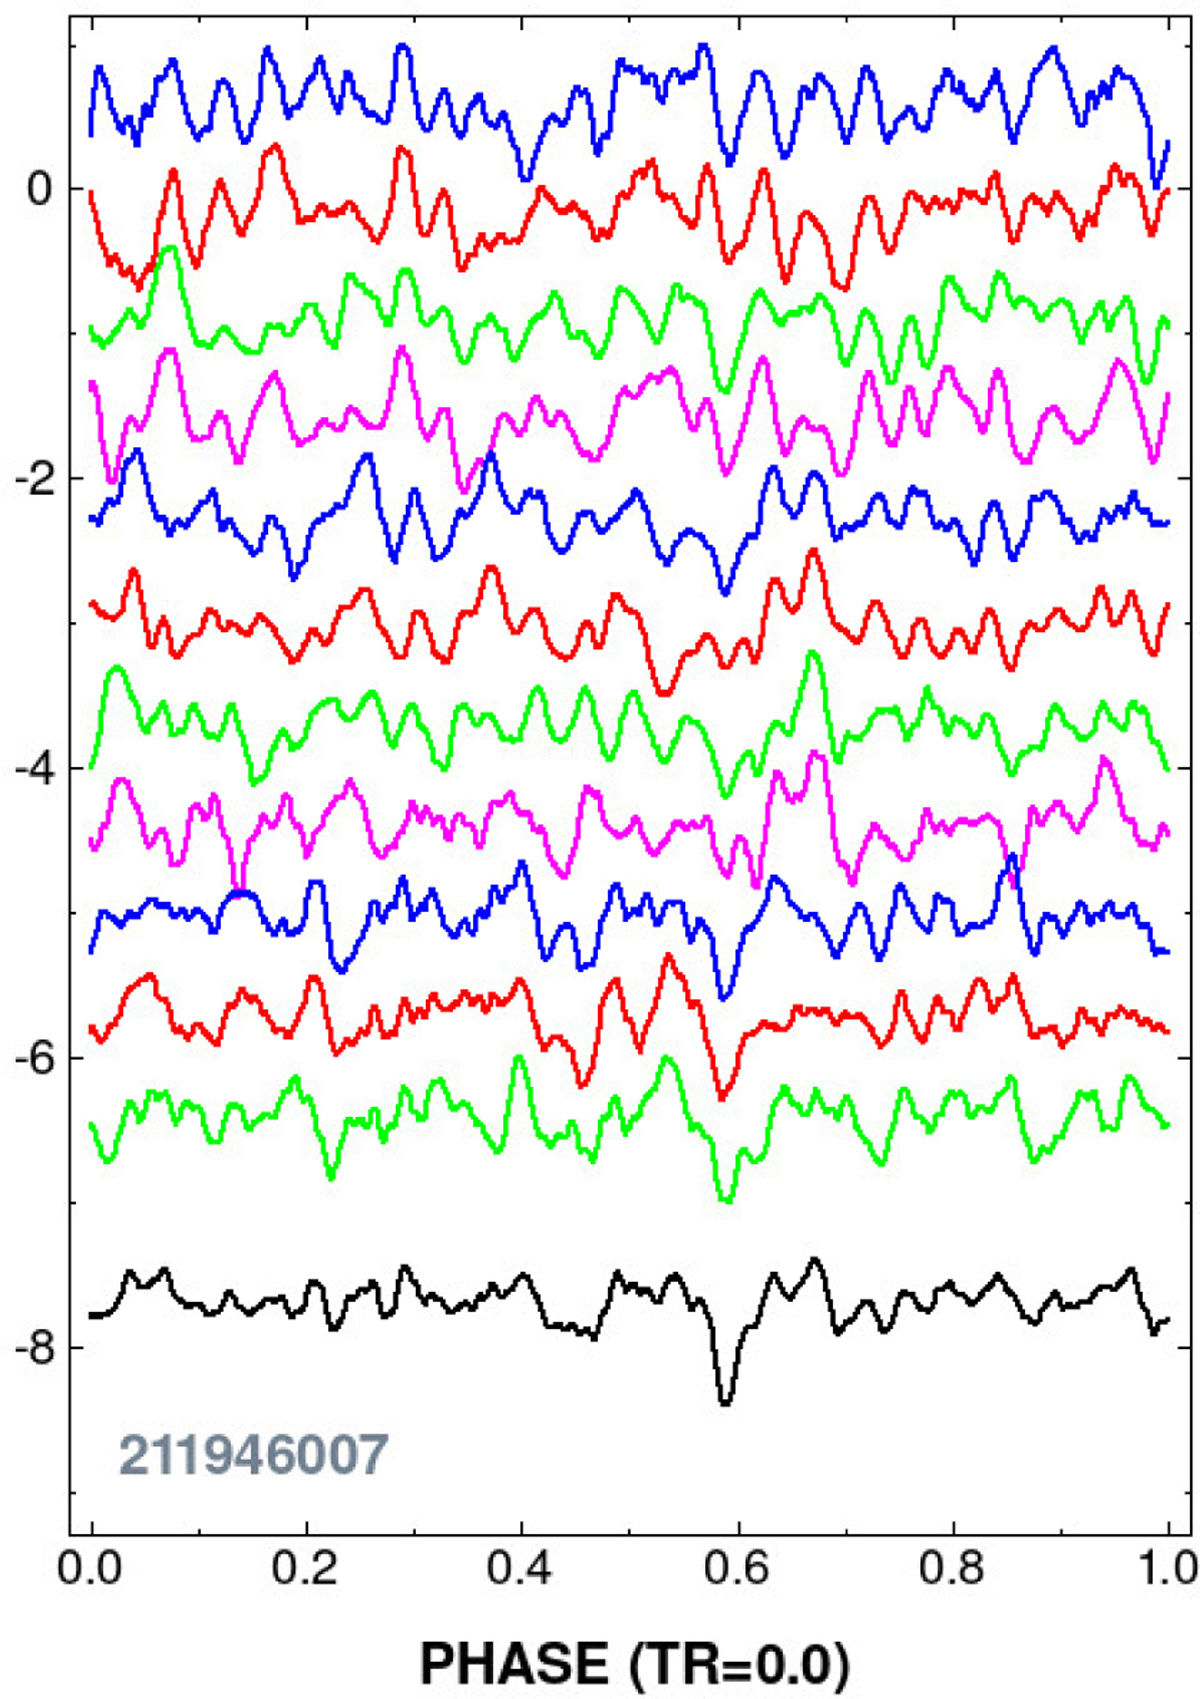
Fig. 7
Download original image
SES statistics for the reconstructed LCs of EPIC 211946007. The structure of the figure is similar to that of Fig. 3. From top to downward, we show the SES statistics derived on the data sources of LUG, KEP, PET and VAN. This pattern is repeated (from top to bottom) for fields C05, C16 and C18 (for the latter, we have only LUG, KEP and VAN). Vertical shifting and scaling are applied as in Fig. 3.
Current usage metrics show cumulative count of Article Views (full-text article views including HTML views, PDF and ePub downloads, according to the available data) and Abstracts Views on Vision4Press platform.
Data correspond to usage on the plateform after 2015. The current usage metrics is available 48-96 hours after online publication and is updated daily on week days.
Initial download of the metrics may take a while.