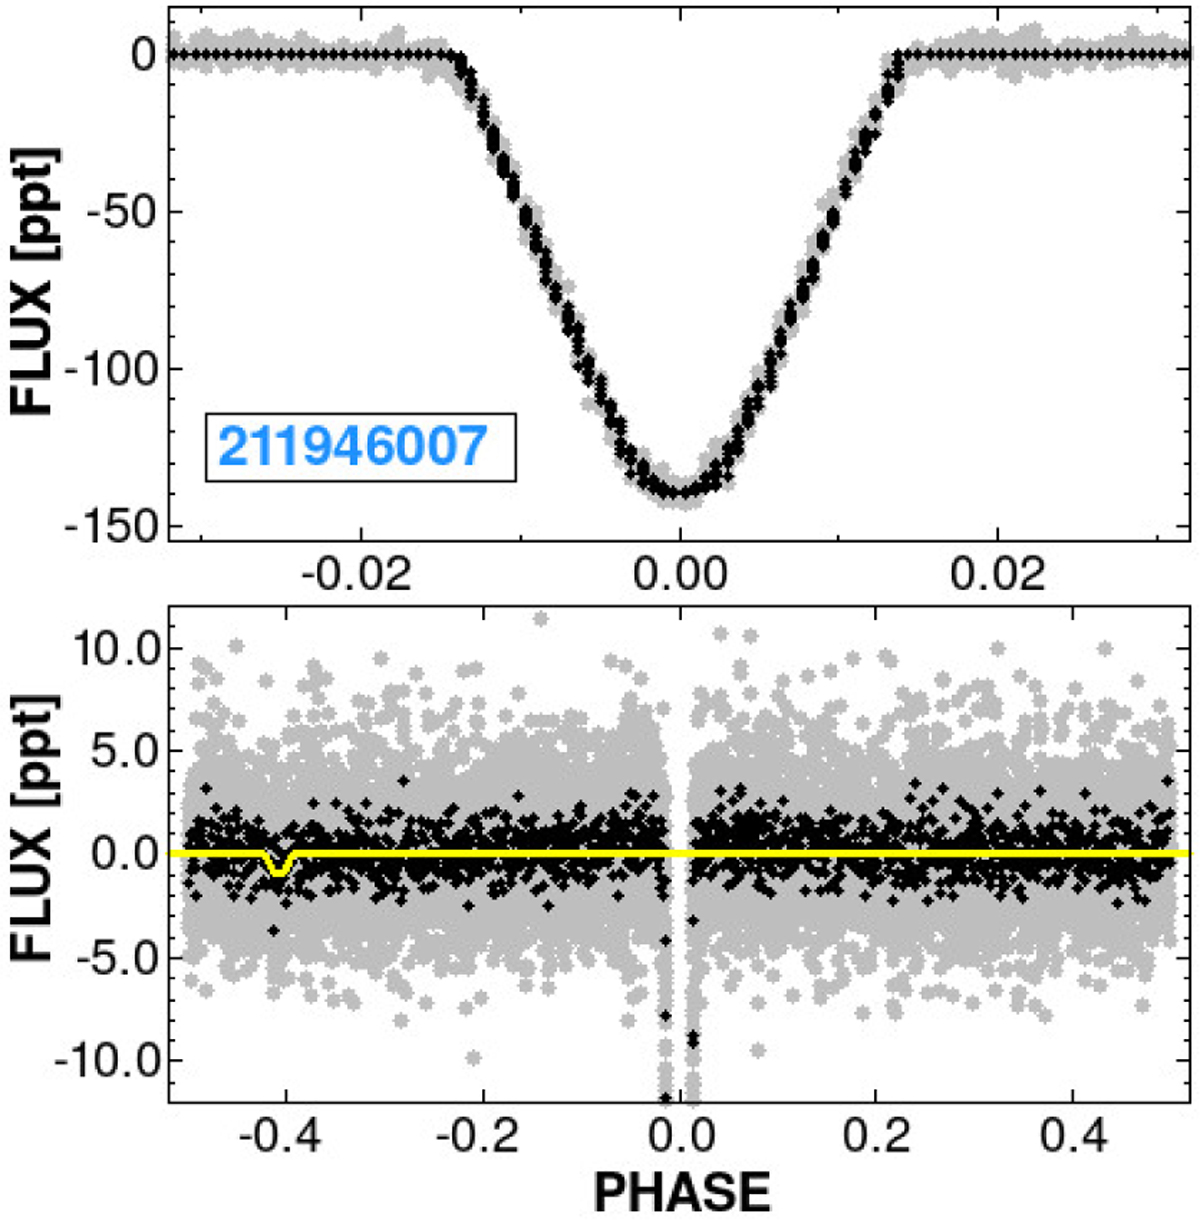
Fig. 9
Download original image
Upper panel: binned transit for the merged, reconstructed LCs (gray), and their U-bottomed trapezoid fits (black, averaged in the same way as the data). Lower panel: gray points as above, black points are the weighted averages of the gray points. The yellow line shows the best-fitting flat-bottomed trapezoid for the secondary eclipse.
Current usage metrics show cumulative count of Article Views (full-text article views including HTML views, PDF and ePub downloads, according to the available data) and Abstracts Views on Vision4Press platform.
Data correspond to usage on the plateform after 2015. The current usage metrics is available 48-96 hours after online publication and is updated daily on week days.
Initial download of the metrics may take a while.