Fig. 2
Download original image
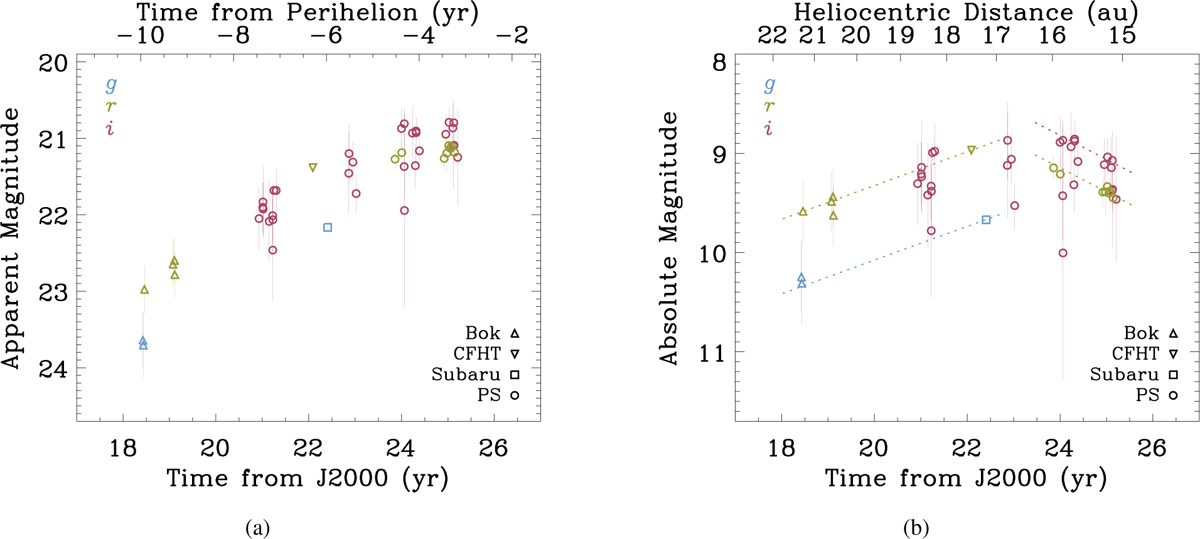
Temporal evolution of (a) apparent magnitude and (b) absolute magnitude of comet C/2025 D1 (Groeller), measured using a 3 × 10⁴ km radius aperture. The upper axes in panels (a) and (b) mark time with respect to the perihelion passage and heliocentric distance, respectively. Data from different facilities are plotted with distinct symbols, with colours corresponding to the bands to which the photometric reduction was calibrated (see the legends). The dotted lines in panel (b) represent the best-fit linear models to derive the colour indices and activity trends of the comet.
Current usage metrics show cumulative count of Article Views (full-text article views including HTML views, PDF and ePub downloads, according to the available data) and Abstracts Views on Vision4Press platform.
Data correspond to usage on the plateform after 2015. The current usage metrics is available 48-96 hours after online publication and is updated daily on week days.
Initial download of the metrics may take a while.