| Issue |
A&A
Volume 704, December 2025
|
|
|---|---|---|
| Article Number | A85 | |
| Number of page(s) | 12 | |
| Section | Planets, planetary systems, and small bodies | |
| DOI | https://doi.org/10.1051/0004-6361/202557175 | |
| Published online | 05 December 2025 | |
Dynamically new comet C/2025 D1 (Groeller) with record perihelion distance
1
Shanghai Astronomical Observatory, Chinese Academy of Sciences,
No. 80 Rd Nandan,
Shanghai
200030,
Mainland
China
2
Physics and Astronomy, The University of Western Ontario,
1151 Richmond Street,
London
ON
N6A 3K7,
Canada
3
Simi Valley,
CA,
USA
4
Institute for Astronomy, University of Hawai‘i,
2680 Woodlawn Drive,
Honolulu,
HI
96822,
USA
5
ESA NEO Coordination Centre, Planetary Defence Office,
Largo Galileo Galilei 1,
00044
Frascati
(RM),
Italy
★ Corresponding author: This email address is being protected from spambots. You need JavaScript enabled to view it.
; This email address is being protected from spambots. You need JavaScript enabled to view it.
Received:
9
September
2025
Accepted:
20
October
2025
Abstract
We studied C/2025 D1 (Groeller), a long-period comet with an unprecedented perihelion distance of 14.1 au, using archival observations. The data reveal that it had been active at inbound heliocentric distances rH ≳ 20 au. Initially, the comet intrinsically brightened at rH ≳ 16 au, with brightening parameters comparable to those of other long-period comets. However, observations after late 2023 showed a gradual decay, despite the inbound trajectory of the comet. To our knowledge such behaviours have not been observed for other long-period comets at similar heliocentric distances. We speculate that this might be linked to the onset of CO2 sublimation and/or crystallisation processes. Alternatively, the activity source might have been exhausted. The surface brightness profile of the coma indicates a steady-state mass loss, implying supervolatile sublimation as the primary driver of the observed activity. Despite changes in the orbital plane angle, the circularly symmetric coma persisted throughout the observation, indicative of the dominance of large grains in the coma. Assuming the activity trend is independent of bandpass, we find that the comet was redder than many other comets in the Solar System. Our model-dependent constraint estimates the radius of the nucleus to be ≳0.4 km. We performed astrometric measurements, refined the orbital solution, and derived the original and future orbits of the comet. Our N-body integration, which accounts for the Galactic tide, strongly favours the comet being dynamically new, with its previous perihelion at ≳60 au from the Sun ≳6 Myr ago. It is highly likely that the comet will be lost from our solar system after the current apparition.
Key words: methods: data analysis / methods: numerical / methods: observational / Oort Cloud / comets: individual: C/2025 D1 (Groeller)
© The Authors 2025
 Open Access article, published by EDP Sciences, under the terms of the Creative Commons Attribution License (https://creativecommons.org/licenses/by/4.0), which permits unrestricted use, distribution, and reproduction in any medium, provided the original work is properly cited.
This article is published in open access under the Subscribe to Open model. This email address is being protected from spambots. You need JavaScript enabled to view it. to support open access publication.
1 Introduction
Comets are volatile-rich relics that formed and survived from the violent and chaotic stages of the early Solar System approximately 4.5 Gyr ago. The present-day Solar System hosts two primary cometary reservoirs—the Kuiper Belt and the Oort Cloud—which supply short- and long-period comets, respectively. In general, short-period comets have heliocentric orbits with modest eccentricities and inclinations with respect to the ecliptic, whereas long-period comets travel on nearly parabolic trajectories from isotropic directions.
Compared to short-period comets, the long-period counterparts may be even more pristine, as they have resided predominantly in a deep-freeze environment with an ambient temperature of ∼10 K since their implantation in the Oort Cloud, even though both types of comets were largely formed in a massive primordial trans-Neptunian disc, with a small fraction born closer to the Sun (e.g. Nesvorný et al. 2017; Vokrouhlický et al. 2019). Long-period comets can be classified as dynamically new or old, depending on whether they have previously entered the planetary region (≲ 15 au; Królikowska & Dybczyński 2010). Although long-period comets – particularly dynamically new ones – are considered among the most pristine small Solar System bodies, they are not immune to thermal processes, as evidenced by their mass-loss activity. While most comets exhibit activity due to water-ice sublimation within heliocentric distances ≲5 au (e.g. Whipple 1950), others can be active at 10 ≲ rH ≲ 16 au, due to the crystallisation of amorphous ice (Guilbert-Lepoutre 2012), or supervolatile (e.g. CO, CO2) sublimation at even greater heliocentric distances (e.g. Jewitt et al. 2021). Even objects as far out as in the Oort Cloud may undergo substantial thermo-physical processing due to cosmic ray bombardment (Gronoff et al. 2020; Maggiolo et al. 2020), which may trigger cometary outbursts therein (Belousov & Pavlov 2024). Despite these processes, long-period comets, especially dynamically new ones with large perihelion distances, remain scientifically significant for understanding the evolutionary pathways of the Solar System.
Comet C/2025 D1 (Groeller) was discovered on 20 February 2025 at an inbound heliocentric distance of rH = 15.1 au. Serendipitous pre-discovery observations, dating back to as early as 2018, were identified, facilitating robust orbit determination (Woodward et al. 2025). According to the JPL Horizons orbital solution, C/2025 D1 has a perihelion distance of q = 14.1 au, the largest known among comets. With a slightly hyperbolic heliocentric eccentricity (e = 1.003) on the inbound leg of the trajectory, due to perturbations of the giant planets, and an orbital inclination nearly orthogonal to the ecliptic (i = 84◦.5), the perihelion passage of the comet will occur in May 2028. In this paper, we analyse archival observations to examine comet C/2025 D1 on the inbound leg of its trajectory.
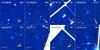 |
Fig. 1 Selected archival observations of comet C/2025 D1 (Groeller). In some of the panels where the comet appears faint, a dotted white circle marks its location. The white and magenta scale bars represent an angular distance of 10′′ and a linear distance of 105 km projected at the observer-centric distance of the comet, respectively. J2000 equatorial north is up, and east is to the left. In each panel the antisolar direction (yellow arrow) and the projected negative heliocentric velocity of the comet in the observer’s sky plane (dark orange arrow) are also indicated. |
2 Observations
We used the Solar System Object Search tool (Gwyn et al. 2012) at the Canadian Astronomy Data Centre (CADC)1 to obtain archival observations of comet C/2025 D1. After visually inspecting the downloaded data, we robustly identified the comet in images from three facilities: the 2.3 m Bok telescope with a four 4032 × 4096 chip charge-coupled device (CCD) at the Kitt Peak National Observatory, the 3.6 m Canada-France-Hawaii Telescope (CFHT) with MegaCam (Aune et al. 2003), and the 8.4 m Subaru telescope with Hyper Suprime-Cam (HSC; Takada 2010), both located at the summit of Mauna Kea, Hawai‘i. The image pixel scales of these facilities are 0′′.453, 0′′.187, and 0′′.166, respectively, all in unbinned mode. In addition to the CADC query, we searched for data taken from the two 1.8 m Pan-STARRS survey telescopes (PS1 and PS2; Chambers et al. 2016) at Haleakalā, Hawai‘i, with an image scale of 0′′.25 pixel−1, and successfully identified the comet therein. The observing information and the viewing geometry of the comet are summarised in Table A.1, and Figure 1 displays selected images of the comet from the archival data.
Except for the CFHT data, the world coordinate system (WCS) header information of the archival data was created or updated using astrometry.net (Lang et al. 2010) in combination with the Gaia data release 2 (DR2; Gaia Collaboration 2018) and Tycho-2 (Høg et al. 2000) catalogues, as catalogued sources were noticed to be visually offset from the observed field sources in SAOImage DS9 (Joye & Mandel 2003). The WCS header information updated by astrometry.net served as a preliminary astrometric calibration for subsequent procedures. All images queried from the CADC, except for a single HSC image (see Table A.1), were further astrometrically calibrated with Gaia DR3 (Gaia Collaboration 2023) in Astrometrica (Raab 2012), yielding the astrometry and associated measurement uncertainties for the comet. Affected by significant vignetting from an edge shadow even after standard calibration, the HSC image exhibited substantial field distortion as a result of diffraction. This baffled Astrometrica. Therefore, we followed the detailed methodology described in Hung et al. (2023) in combination with AstroMagic2 to visualise pattern matching while accounting for the field distortion coefficients specific to the HSC CCD chip. This approach enabled the successful measurement of the comet’s astrometry and associated error in this HSC image. Using the same technique applied in Hui et al. (2024a) and Hui et al. (2024b), we measured the astrometry of the comet in the PS images, which were already astrometrically and photometrically calibrated (Waters et al. 2020).
Although the non-PS images were photometrically calibrated by Astrometrica during the astrometric reduction, the results were preliminary, necessitating refined photometric calibration. To improve the calibration, we measured fluxes of field stars using a circular aperture with a radius equal to twice the mean seeing full-width half maximum value of field stars and estimated the sky background from a concentric annulus with inner and outer radii of twice and four times the photometric aperture radius, respectively. Referencing ATLAS Refcat2 (Tonry et al. 2018), we determined the zero-point (and the colour term, if statistically significant) for each image, best fitted using MPFIT (Markwardt 2009), as done in our previous work (e.g. Hui et al. 2024a). To minimise potential effects from the varying observing geometry of C/2025 D1, we performed photometry of the comet using circular apertures with fixed linear radii projected at its observer-centric distance, ranging from 2.5×10⁴ to 4×10⁴ km in increments of 5000 km. The sky background was estimated from a concentric annulus with inner and outer radii equal to twice and four times, respectively, the angular radius of the largest circular aperture used for comet photometry. Photometry of the comet in the PS data was more straightforward, as there was no need to estimate the sky background, and we adopted the same fixed apertures using the method described in Hui et al. (2024a). For non-PS images photometric uncertainties were propagated from errors in the photometric recalibration and flux measurement uncertainties, assuming Poisson statistics. However, for the PS data, which were sky-subtracted, Poisson statistics were inapplicable. Fortunately, most PS-observed epochs had multiple measurements in the same filter from the same night (see Table A.1), allowing us to use the standard deviation of repeated measurements as the measurement error. The few PS measurement singletons were discarded.
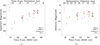 |
Fig. 2 Temporal evolution of (a) apparent magnitude and (b) absolute magnitude of comet C/2025 D1 (Groeller), measured using a 3 × 10⁴ km radius aperture. The upper axes in panels (a) and (b) mark time with respect to the perihelion passage and heliocentric distance, respectively. Data from different facilities are plotted with distinct symbols, with colours corresponding to the bands to which the photometric reduction was calibrated (see the legends). The dotted lines in panel (b) represent the best-fit linear models to derive the colour indices and activity trends of the comet. |
3 Results
3.1 Brightness
In Figure 2a, we plot the apparent magnitude of comet C/2025 D1, measured using a 3 × 10⁴ km radius aperture, against time. As the secular apparent light curves are highly similar across different apertures, results from other apertures are not included to avoid clutter. We note that the comet appeared to brighten more rapidly at earlier times, followed by a slowdown in its brightening after approximately late 2023. However, this does not necessarily reflect the intrinsic trend of the comet owing to the varying observing geometry. To examine the intrinsic trend, we computed the absolute magnitude, defined as the magnitude of the comet at heliocentric and observer-centric distances rH = ∆ = 1 au and a phase angle of α = 0◦, related to the apparent magnitude by
 (1)
(1)
Here, Hλ and mλ are the absolute and apparent magnitudes of the comet, respectively, reduced to bandpass λ. We assumed a linear phase function with a phase coefficient of βα = 0.03 ± 0.01 mag degree−1 typical for comets (Meech & Jewitt 1987). The results, shown in Figure 2b, reveal distinct brightening trends before and after approximately late 2023 – the comet intrinsically brightened up to around late 2023 but began to fade thereafter, despite still approaching perihelion.
To quantify the intrinsic brightening trend, we fitted a linear model to the absolute magnitude of the comet in the time domain using MPFIT. Only the g- and r-band data points at epochs earlier than 2023 were used to best fit the intrinsic brightening trend simultaneously. By contrast, the fading trend was fitted with the r- and i-band data points from late 2023 onward, as the times-pan covered by the i-band data points was not compatible with the other two bands before 2023. Including the i-band data in the fitting would have introduced an extra free parameter in the model, which we preferred not to do, given the quality of these data points. We defined the goodness of the fit as
 (2)
where
(2)
where  denotes the linear model as a function of Θ, the 2D parameter (slope and intercept), and time t, expressed in years relative to J2000. The subscripts 1 and 2 denote the two simultaneously fitted bandpasses.
  is the colour index between the two bandpasses, and σ is the uncertainty of the absolute magnitude. These parameters were obtained by minimising Equation (2) using MPFIT, i.e.
 (3)
(3)
In Table 1, we tabulate the best-fit parameters (excluding the intercept, as it is of little interest) for different photometric apertures. The best-fit linear models for the 3 × 10⁴ km radius aperture are also plotted as dotted lines in Figure 2b. Given the uncertainties the best fits across different photometric apertures are consistent with each other. Therefore, we also present their weighted means and standard deviations in Table 1.
Best-fitted linear models for the brightening trend.
3.2 Colour
We first examine the derived colours of C/2025 D1. The colour indices g − r and r − i were obtained using observations spanning different time periods, before and after late 2023, respectively. However, Holt et al. (2024) showed that no long-period comets in their sample exhibited colour variations with heliocentric distance unless at rH ≲ 3 au. Although the ultra-distant comet C/2010 U3 (Boattini) was reported to display colour variation, this did not occur until it reached the crystallisation zone at rH ≲ 10 au (Hui et al. 2019). We therefore consider our assumption that the colour of C/2025 D1 remains unchanged at the observed heliocentric distances rH ≳ 15 au is likely valid.
Given that the results from different apertures are consistent with each other within their uncertainties, we selected those from the 3 × 10⁴ km radius aperture as representative. Our best-fit colour indices for the comet, g − r = +0.72 ± 0.07 and r − i = +0.32 ± 0.06, are redder than the solar colours(g - r = +0.46±0.03 and r − i = +0.12 ± 0.03; Willmer 2018) at 3.4σ and 3.0σ significance, respectively. Compared to the median colours of comets, reported as g − r +0.57 ± 0.05 and r – i = +0.22 ± 0.07 by Solontoi et al. (2012), C/2025 D1 is redder at a 1.7σ significance in g − r and 1.1σ in r − i. For a direct comparison, we plot the colour of the comet alongside those of various small Solar System body populations and the Sun in Figure 3. We can notice that the comet lies closely to the reddening line (corresponding to linear reflectivity gradients) in the colour-colour diagram, as observed for most small bodies in the outer Solar System (Hainaut & Delsanti 2002). This in turn lends additional support to our assumption that the comet does not vary in colour. Although C/2025 D1 is redder than typical comets, including other long-period comets, it is not the reddest ever measured, given the uncertainties arising from the suboptimal quality of the archival data. The finding that C/2025 D1 is likely not ultra-red, despite being at heliocentric distances much greater than some of the ultra-red Centaurs, may support the hypothesis that the ultra-red matter disappears as cometary activity onsets (e.g. Jewitt 2015).
For completeness we also calculated the normalised reflectivity gradient (A’Hearn et al. 1984; Jewitt & Meech 1986):
 (4)
where ∆λ1,2 = λ1 − λ2 is the central wavelength difference between two bandpasses and ∆C1,2 is the colour index difference relative to the Sun. The normalisation is chosen at the midpoint of the covered spectral interval. Using the results from the 3 × 10⁴ km radius aperture, Equation (4) yields
(4)
where ∆λ1,2 = λ1 − λ2 is the central wavelength difference between two bandpasses and ∆C1,2 is the colour index difference relative to the Sun. The normalisation is chosen at the midpoint of the covered spectral interval. Using the results from the 3 × 10⁴ km radius aperture, Equation (4) yields  per 103 Å and
  per 10 Å in the g − r and r − i spectral intervals, respectively. These values are comparable to those of other long-period comets at large heliocentric distances (Kulyk et al. 2018). A slightly different definition of the normalised reflectivity gradient
  was introduced by Hainaut & Delsanti (2002), which is instead normalised at the V-band central wavelength. The relationship between the two normalised reflectivity gradients is
 (5)
where
(5)
where  is the mean wavelength of the spectral interval. The corresponding normalised reflectivity gradients we obtained are
  per 103 Å in the g − r interval and
  per 103 Å in the r − i interval, reinforcing that the reflectivity gradient of the comet is statistically linear over the g − i spectral interval.
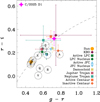 |
Fig. 3 Colour of C/2025 D1, measured using a 3 × 10⁴ km radius photometric aperture, compared with various small Solar System body populations (Dandy et al. 2003; Szabó et al. 2007; Solontoi et al. 2012; Jewitt 2015; Markwardt et al. 2023, and citations therein) and the Sun (Willmer 2018). The colours reported in non-SDSS systems are transformed to the SDSS system following Jordi et al. (2006). The open circles with letters at their centres represent main-belt asteroids of specific taxonomic types. The objects with linear reflectivity gradients in the g − i spectral interval form the reddening line, drawn as the dashed grey curve. |
3.3 Activity
Now we focus on the derived brightening slope of comet C/2025 D1, using results from the 3 × 10⁴ km radius aperture. According to our best-fit linear models to the available observations, comet C/2025 D1 intrinsically brightened at a rate of  mag yr−1 until approximately late 2023 at a heliocentric distance of rH ≈ 16 au. Subsequently, however, it began to fade at a rate of 0.17 ± 0.06 mag yr−1 towards the present. In the literature cometary activity is more often characterised by the activity parameter k, defined as the slope of the heliocentric magnitude (normalised to observer-centric distance ∆ = 1 au and phase angle α = 0◦) with respect to log rH. Instead of refitting the linear model in the log rH domain, we estimated the activity parameter using the chain rule as
 (6)
(6)
Here,
 (7)
is an auxiliary timescale, simplified by approximating the comet’s pre-perihelion heliocentric trajectory as a parabola in the two-body problem, given eccentricity e ≈ 1. Here, q and ν are the perihelion distance and true anomaly of the comet, respectively, and µ⊙ = 2.96 × 10⁻⁴ au3 d−2 is the mass parameter of the Sun. Substitution into Equation (6) yields k = 12 ± 2 for the brightening phase before approximately late 2023, comparable to values for other long-period comets, whether dynamically new or old, as reported by Holt et al. (2024) and Lacerda et al. (2025). However, from approximately late 2023 onwards, the comet faded with an activity parameter of k = –4 ± 3.
(7)
is an auxiliary timescale, simplified by approximating the comet’s pre-perihelion heliocentric trajectory as a parabola in the two-body problem, given eccentricity e ≈ 1. Here, q and ν are the perihelion distance and true anomaly of the comet, respectively, and µ⊙ = 2.96 × 10⁻⁴ au3 d−2 is the mass parameter of the Sun. Substitution into Equation (6) yields k = 12 ± 2 for the brightening phase before approximately late 2023, comparable to values for other long-period comets, whether dynamically new or old, as reported by Holt et al. (2024) and Lacerda et al. (2025). However, from approximately late 2023 onwards, the comet faded with an activity parameter of k = –4 ± 3.
Assuming that the brightness of the comet is dominated by scattering by dust grains surrounding the nucleus in its coma at such heliocentric distances, we evaluated the evolution of its effective scattering cross-section,
 (8)
where pr = 0.05 is the nominal r-band geometric albedo of cometary dust, r⊕ = 1 au, m⊙,r = −26.93 is the apparent r-band magnitude of the Sun (Willmer 2018), and Hr is the absolute r-band magnitude of the comet. Assuming the effective cross-section follows a power-law function of heliocentric distance, i.e.
(8)
where pr = 0.05 is the nominal r-band geometric albedo of cometary dust, r⊕ = 1 au, m⊙,r = −26.93 is the apparent r-band magnitude of the Sun (Willmer 2018), and Hr is the absolute r-band magnitude of the comet. Assuming the effective cross-section follows a power-law function of heliocentric distance, i.e.  , we found the power-law index:
 (9)
(9)
Using the 3 × 10⁴ km radius aperture, Equation (9) yields γ = −2.6 ± 0.7 and 4 ± 1 for the time periods before and after around late 2023, respectively. The power-law index during the brightening phase is potentially steeper than those measured for ultra-distant comets C/2017 K2 (PANSTARRS) and C/2019 E3 (ATLAS) (γ ≈ −1; Jewitt et al. 2021; Hui et al. 2024a), but the large uncertainty of our results does not preclude the possibility that these comets exhibit a resemblance in their brightening behaviour. Additionally, the power-law index from the brightening period aligns with expectations for CO-driven sublimation activity at similar heliocentric distances (−2.4 ≤ γ ≤ –2.2; Kelley et al. 2022).
We estimated the rate of change in the effective cross-section of the cometary dust by using the power-law index γ and again applying the chain rule as
 (10)
yielding a time-averaged rate of change of
(10)
yielding a time-averaged rate of change of  for the effective cross-section of dust during the brightening phase of the comet and (−8 ± 3) × 102 km2 yr−1 during the fading phase. Assuming a bulk density of ρd = 1 g cm−3 (see Engrand et al. 2024, and citations therein) and a minimum grain radius of 1 mm (see Section 3.4), we constrained the mass loss of the comet C/2025 D1 to be ≳ (3 ± 1) × 104 g s−1 during its intrinsic brightening phase before late 2023. We did not attempt to constrain the mass loss during the fading phase, as the decrease in the effective cross-section of dust likely resulted from an inefficient supply of newly ejected dust relative to the dust lost from the photometric aperture.
Based on the available observations, the activity of C/2025 D1 prior to late 2023 was consistent with CO-driven sublimation and did not exhibit peculiar behaviour. However, it subsequently started to fade over a year-long timescale. To our knowledge no other long-period comet has exhibited similar fading at such large heliocentric distances while on the inbound leg of its orbit. While it is well known that dynamically new comets often exhibit a slowdown in brightening at rH ≈ 3 au (Lacerda et al. 2025, and citations therein), this is inconsistent with our observations for C/2025 D1.
The decline in intrinsic brightness of the comet resembled that of post-outburst comets. However, the observed fading rate was likely too shallow. For instance, Kelley et al. (2022) reported that the ultra-distant comet C/2014 UN271 (Bernardinelli-Bernstein) faded at a rate of ∼0.01 mag day−1, dominating its post-discovery brightness. The post-outburst Jupiter-family comets 17P/Holmes and 332P/Ikeya-Murakami faded at similar rates of ≲ 0.1 mag day−1 (Ishiguro et al. 2014). Although interstellar object 2I/Borisov exhibited a comparable fading rate of  day−1 on the outbound leg of its orbit (Jewitt et al. 2020), the brightening of C/2025 D1 occurred over a timescale orders of magnitude longer than the typical cometary outbursts, which last no more than a few days. The comet’s decline appeared to be overly prolonged compared to the typical post-outburst fading timescales of comets.
The declining behaviour is nevertheless reminiscent of cometary disintegration. Arguing against this hypothesis, the photocentre of C/2025 D1 remained solid in high signal-to-noise ratio (S/N) observations throughout the fading phase (see Figure 1), and its motion is well described by a pure-gravity orbital solution (see Section 3.5). Both pieces of evidence are inconsistent with a disintegration scenario.
Thus, we disfavour the hypotheses that C/2025 D1 underwent an outburst or is in the process of disintegrating. Instead, we propose that the decrease in the effective cross-section of the cometary dust might result from sublimation of volatiles previously stored in solid state. Applying the simplistic free sublimation model of Cowan & A’Hearn (1979) neglecting heat conduction towards the nucleus interior, with updated physical parameters updated from Fray & Schmitt (2009), we find that the onset of CO2 would occur at 10 ≲ rH ≲ 20 au. In addition, numerical simulations by Guilbert-Lepoutre∼ (2012) suggest that the crystallisation of amorphous water ice can be triggered at rH = 16 au, which is approximately the distance where the fading of C/2025 D1 began. We therefore speculate that the onset of CO2 activity and/or crystallisation caused the observed fading of the comet starting from around late 2023, whereby the intensified activity in turn reduced the total effective scattering cross-section of cometary dust grains as their CO2 and/or H2O ices underwent phase transition. This is analogous to the fact that many dynamically new comets slow down in brightening when approaching the Sun within rH ≲ 3 au (e.g. Lacerda et al. 2025). The perihelion distance of the comet close to the transition boundary may have amplified the behaviour.
Alternatively, it is possible that the observed fading of C/2025 D1 resulted from the exhaustion of its supervolatiles. Here, we estimated the thickness of its CO ice layer using the same simplistic sublimation model in an order-of-magnitude manner, finding a CO mass flux of fs ≈ 3 × 10⁻⁶ kg m−2 for an isothermal nucleus during the brightening phase of the comet, which lasted for at least ∆t ≈ 5 yr. Assuming a bulk density of ρn = 0.5 g cm−3 for the cometary nucleus (e.g. Guilbert-Lepoutre et al. 2024, and citations therein), we obtain an erosion of the comet of fs∆t/ρn ≳ 1 m in thickness during this period solely due to CO sublimation. Thus, if the CO ice layer was not much thicker, we would expect the sublimation activity of the comet to be exhausted. Unfortunately, with the available data, we are unable to verify the aforementioned possibilities. Further observations are needed to better understand the specific cause of the observed fading of the comet. We expect new sky surveys, such as the Vera C. Rubin Observatory Legacy Survey of Space and Time, to discover more distant comets exhibiting similar fading behaviour, provided the fading is caused by activity transition and their perihelion distances lie just inside the transition zone.
Finally, we estimated the nucleus size of C/2025 D1. The brightness of the comet is primarily due to dust particles ejected from the nucleus, hindering effective constraints on the nucleus size using the secular light curve. Instead, we continued to use the simplistic CO sublimation model, assuming a conservative dust-to-gas mass production ratio of 5 following Jewitt et al. (2019). The model predicted a maximum mass flux of ∼10−5 kg m−2 s−1 during the brightening phase of the comet. To sustain the observed activity, a minimum active surface area of (6 ± 2)×105 m2 is required, corresponding to a lower limit on the radius of a circular active patch of (4.2 ± 0.8) × 102 m. The physical parameters of the comet estimated from other photometric apertures are not statistically different from those obtained with the 3 × 10⁴ km radius aperture. Our constraint on the nucleus size here is likely no better than an order-of-magnitude estimate, because the model oversimplifies the actual complexity of the cometary activity in C/2025 D1.
3.4 Morphology
The physical properties of the dust environment of C/2025 D1 can be inferred from its morphology, which is dominated by ejected dust grains. Unfortunately, the faintness of the comet precluded effective constraints on its dust environment through modelling of the dust morphology (e.g. Moreno 2022). Visual inspection reveals that the comet maintained a largely circularly symmetric appearance throughout the observed period, irrespective of the orbital plane angle (see Figure 1 and Table A.1). Notably, the CFHT observation was acquired when Earth happened to be in the orbital plane of the comet, a configuration in which many comets exhibit a linear morphology centred on the projected orbital plane. This is because the in-orbit dispersion of small dust particles (primarily caused by solar radiation pressure) is much greater than the out-of-plane dispersion (primarily due to the initial dust ejection speed). The fact that the comet did not exhibit an increasingly diffuse appearance in observations from the fading phase further argues against the disintegration possibility. The morphology of C/2025 D1 closely resembles that of ultra-distant comets C/2017 K2 (PANSTARRS) and C/2019 E3 (ATLAS), whose comae were reported to be optically dominated by large dust grains (at least submillimetre- to millimetre-scaled; Hui et al. 2024a; Jewitt et al. 2019). Accordingly, we postulate that the dust environment of C/2025 D1 is similarly dominated by large dust particles, as a possible consequence of supervolatile sublimation at large heliocentric distances. Future observations are needed to investigate the physical parameters of the dust environment of the comet.
We attempted to infer the activity mechanism of the comet from its surface brightness profile. The highest S/N archival observations of the comet were obtained on 2 February 2022 from CFHT and 30 May 2022 from HSC. To compute the surface brightness profile, we used a series of circular apertures with radii ranging from 1 pixel to 4′′ in increments of 1 pixel, centred on the photocentre of the comet, to obtain the enclosed total brightness. The sky background and associated uncertainty were determined as described in Section 2. The surface brightness was then calculated by differentiating the total brightness with respect to the aperture area. We plot the surface brightness profiles of the comet as functions of radial distance from the photocentre of the comet for the aforementioned two epochs in Figure 4, normalised to the peak surface brightness. As evident the low S/N causes the signal of the coma to quickly fade into the sky background beyond ≳3′′ from the photocentre. However, the profile within ∼1′′ from the photocentre are distorted by convolution with the seeing and optical system. Therefore, we fitted a power-law model using MPFIT to the profiles in an annulus from 1′′ to 3′′ of the photocentre, which we consider more representative of the true profile. This yields the logarithmic surface brightness slope, which is the power-law index of the model, to be −1.1 ± 0.4 and −1.3 ± 0.4 for the CFHT and HSC observations, respectively, both in agreement with a coma in steady state given the uncertainties. These results lend support to the interpretation that the observed activity of the comet is driven by sublimation of supervolatiles, such as CO and/or CO2.
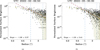 |
Fig. 4 Radial surface brightness profiles of comet C/2025 D1 on (a) 2 February 2022 from CFHT and (b) 30 May 2022 from HSC. These images have higher S/N for the comet than any other observations we collected. The azimuthally averaged surface brightness is plotted in olive green. The best-fit radial surface brightness model is shown as a dashed red line, with the derived logarithmic surface brightness slope indicated in the lower left corner. The boundaries of the fitted region are marked by the two vertical dashed blue lines. |
3.5 Orbit
In addition to our own astrometric measurements, we obtained more recent astrometry of comet C/2025 D1 using the Minor Planet Center (MPC) Observations application programming interface (API) tool3. The observations were de-biased according to star catalogues following Eggl et al. (2020), weighted using the measurement uncertainties or, for MPC observations without reported uncertainties, following Vereš et al. (2017), and best fitted with a gravity-only model (Keplerian orbital elements as the six free parameters) in Find_Orb4, which utilised the planetary and lunar ephemeris DE441 (Park et al. 2021) and accounted for gravitational perturbations from the eight major planets, the Moon, Pluto, and the 16 most massive main-belt asteroids. For completeness the oblateness of the Sun and the Earth, as well as post-Newtonian corrections, were incorporated, although they had negligible effects on the orbital determination. The preliminary gravity-only solution yielded no noticeable systematic trends in the observed-minus-calculated (O – C) residuals but showed outliers beyond 3σ. We rejected these measurements, including 16 of the 81 PS measurements and 12 of the 59 measurements downloaded from the MPC. The rejected PS measurements are all from extremely low S/N images. We performed a test by including the rejected PS data points and inflating their uncertainties to a common value of 0′′.5 based on their O – C residuals, rather than discarding them. The resulting gravity-only orbital solution remained statistically consistent, indicating the robustness of the solution. Table 2 lists the best-fit Keplerian orbital elements of the comet from the version without error inflation.
Although the best-fit osculating heliocentric orbit of comet C/2025 D1 at the referenced epoch is slightly hyperbolic, this does not necessarily imply an extrasolar origin. We studied the orbital evolution of comet C/2025 D1 by integrating the nominal orbit and 1000 Monte Carlo massless clones, generated according to the nominal orbit and its full covariance matrix, backwards in time. The covariance matrix was properly propagated from the uncertainties in the astrometric observations. While time consuming the Monte Carlo approach provides a straightforward and reliable method to map uncertainties. We first derived the ‘original’ orbit of the comet, defined as its Solar System barycentric osculating orbit at a pre-perihelion heliocentric distance of rH = 250 au (Dybczyński 2001). Since this moment falls within the time coverage of DE441, we still employed Find_Orb with the same configuration as in the orbit determination to perform the N-body integration for the 1001 test particles. We recorded the epochs when the test particles reached pre-perihelion rH = 250 au and obtained their corresponding heliocentric states through interpolation with relevant tools by JPL’s Navigation and Ancillary Information Facility (NAIF; Acton 1996; Acton et al. 2018). We then computed the Solar System barycentric states by shifting the origin from the Sun to the Solar System barycentre with DE441 and converted the results to Keplerian orbital elements. The distribution of each orbital element was well described by a Gaussian, and therefore, we calculated the mean and standard deviation, as shown in Table 3. The Solar System barycentric eccentricity e < 1 and semi-major axis a = (3.6 ± 0.1) × 104 au unequivocally indicate that C/2025 D1 is a long-period comet from the Oort Cloud on the outskirts of our Solar System. Using Kepler’s third law, we estimate that the previous apparition of the comet occurred ~7 Myr ago.
To investigate the previous return, we must take into account at least the influence of the Galactic tide, which becomes pronounced at the Oort Cloud heliocentric distances (e.g. Heisler & Tremaine 1986). However, this effect is not included in Find_Orb, and the previous perihelion occurs well beyond the time coverage of DE441. We therefore employed mercury6, modified from the original version by Chambers (1999) to include the Galactic tide and post-Newtonian corrections, to study the previous perihelion return of C/2025 D1 using the same 1001 test particles. For consistency we used the states of planetary systems from DE441 and the best-fit orbital elements of C/2025 D1 as initial conditions for the N-body integration in mercury6. The same gravitational perturbations were included, although the Earth-Moon system was represented by their barycentre rather than separately as in the orbit determination. To model the Galactic tide, we adopted a nominal mass density in the solar neighbourhood of ρ∗ = 0.185 M⊙pc−3 (M⊙ is the solar mass; Bahcall 1984) in the integration. Using pertinent NAIF routines, we monitored and recorded the perihelion passages of the nominal orbit and its Monte Carlo clones by searching for local minima in their heliocentric distances prior to the current apparition. Test particles reaching beyond rH = 106 au were considered lost from the Solar System, and ten such test particles were dropped from our backward integration. Our results for the remaining 990 clones and the nominal orbit reveal that the previous perihelion of C/2025 D1 occurred between ∼5.9 and 7.6 Myr ago, at a heliocentric distance between ~60 and 200 au (see Figure 5), suggesting that the comet is dynamically new. We acknowledge the limitation that our N-body integration did not incorporate perturbations from random passing stars, which can influence the motion of long-period comets. Such close stellar encounters are possibly not rare, occurring at a rate of ∼20 Myr−1 within 1 pc of the Sun (Bailer-Jones et al. 2018). Subsequent to our numerical integration, Dybczyński & Królikowska (2025) updated the Catalogue of Cometary Orbits and their Dynamical Evolution (CODE catalogue), including C/2025 D1. While their result without stellar perturbations yields a previous perihelion distance of the comet largely consistent with ours, the model taking into account stellar perturbations suggests a much further perihelion distance of q ≳ 103 au. Therefore, we are confident that C/2025 D1 is a dynamically new comet.
We also studied the future orbital evolution of the comet. Using Find_Orb we first determined the ‘future’ orbit at a post-perihelion heliocentric distance of rH = 250 au for the nominal orbit and its 1000 Monte Carlo clones. Table 3 presents the mean orbital elements and their uncertainties of the future orbit, as their uncertainty distributions closely follow Gaussian distributions. Our findings indicate that, due to planetary perturbations, the future orbit of the comet possibly becomes hyperbolic, implying its escape from the Solar System. Although this result is not statistically significant (1.8σ), we argue that the comet will likely be lost from the Solar System, as the 46 test particles with Solar System barycentric eccentricity <1 (a 4.6% fraction of the total) all have semi-major axes ≳106 au for their future orbits, comparable to the distances of the nearest stars to the Solar System. This finding aligns with the predictions in the CODE catalogue by Dybczyński & Królikowska (2025), which incorporates the Galactic tide (and stellar perturbations) and estimates a 0.1% probability of the comet remaining bound to the Solar System after the current perihelion passage.
We acknowledge that the above analysis does not account for non-gravitational effects, which are commonly observed in comets due to anisotropic activity and/or splitting (e.g. Boehnhardt 2004; Yeomans et al. 2004). To investigate whether the observed decline in intrinsic brightness of comet C/2025 D1 could result from disintegration, we refitted the astromet-ric measurements in Find_Orb using a non-gravitational model that included the area-to-mass ratio (AMR) as an additional free parameter to account for solar radiation pressure. Our findings indicate that the best-fit AMR, (6 ± 9) × 10−2 m2 kg−1, is not statistically significant and that the normalised residual rms showed negligible improvement. Therefore, given also the multi-year observed arc, we conclude with confidence that there is no astrometric evidence of disintegration in comet C/2025 D1, and that the gravity-only analysis remains robust.
Best-fit orbital solution for C/2025 D1 (Groeller).
Original and future orbits of C/2025 D1 (Groeller).
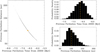 |
Fig. 5 Orbit of C/2025 D1 at its previous perihelion, derived from the Monte Carlo clones. Left panel: orbital uncertainty in the space of perihelion time and distance. Right two panels: corresponding probability density distributions for each element. The nominal orbit is highlighted in orange. For the N-body integration, we adopted a local mass density in the solar neighbourhood of ρ∗ = 0.185 M⊙ pc−3 (Bahcall 1984). |
4 Summary
In this paper, we presented a study of long-period comet C/2025 D1 (Groeller), whose perihelion distance is larger than any other known comet, using archival observations. The key findings are as follows:
The ultra-distant comet exhibited pre-perihelion activity at heliocentric distances rH ≳ 20 au. While its activity intensified, resembling other long-period comets at earlier epochs, it began to decline starting approximately from late 2023 at heliocentric distances rH ≈ 16 au. The mechanism for the fading is unclear, but we disfavour an outburst and disintegration hypotheses. Instead, we conjecture that it may be related to the onset of CO2 activity and/or crystallisation of amorphous ice, or that the comet might have exhausted its supervolatile supply;
Assuming the activity trend is not bandpass dependent, we derived the colour of the comet to be g − r = +0.72 ± 0.07 and r − i = +0.32 ± 0.06 (measured from a 3 × 10⁴ km radius aperture). This colour is significantly redder than the Sun and also redder than many Solar System comets. However, it is likely not the reddest ever measured;
By measuring the astrometry of the comet in the archival data, we improved the orbital solution, based on which we derived the original and future orbits of the comet in a Monte Carlo approach. Our N-body numerical integration incorporating the influence from the Galactic tide reveals that the comet is highly likely dynamically new from the Oort Cloud. The previous perihelion occurred ≳6 Myr ago at a distance of ≳60 au from the Sun. However, subsequent to the current apparition, it is highly likely that the comet will become gravitationally unbound to the Solar System due to planetary perturbations;
From the best archival observations, we computed its surface brightness profiles and find them to be consistent with a coma in steady state, which implies the observed activity being driven by the sublimation of supervolatiles. The coma remained largely circularly symmetric throughout the observed period despite changes in the orbital plane angle. Therefore, we postulate that the dust environment of the comet primarily consisted of large dust grains (at least submillimetre- to millimetre-scaled);
Our model-dependent estimate, assuming CO-driven activity, constrained the nucleus radius to be ≳ 0.4 km in order to sustain the observed brightening trend in the brightening phase prior to approximately late 2023.
Acknowledgements
We thank Olivier Hainaut for a thorough and detailed review on our manuscript, Bill Gray for implementing his orbit determination software Find_Orb, Xiang Tang for setting up a server at the Shanghai Astronomical Observatory for the N-body integration runs, and observers who measured and submitted their astrometric observations of C/2025 D1 (Groeller) to the Minor Planet Center. Pan-STARRS is supported by the National Aeronautics and Space Administration under Grants 80NSSC18K0971 and 80NSSC21K1572 issued through the SSO Near Earth Object Observations Program. This research has made use of data and services provided by the International Astronomical Union’s Minor Planet Center and the facilities of the Canadian Astronomy Data Centre operated by the National Research Council of Canada with the support of the Canadian Space Agency. This work was financially supported by a grant to M.T.H. J.C.S. and X.S. are financially supported by the National Natural Science Foundation of China through Grants Nos. 12173093 and 12233003, respectively.
References
- Acton, C. H. 1996, Planet. Space Sci., 44, 65 [Google Scholar]
- Acton, C., Bachman, N., Semenov, B., & Wright, E. 2018, Planet. Space Sci., 150, 9 [Google Scholar]
- A’Hearn, M. F., Schleicher, D. G., Millis, R. L., Feldman, P. D., & Thompson, D. T. 1984, AJ, 89, 579 [Google Scholar]
- Aune, S., Boulade, O., Charlot, X., et al. 2003, SPIE Conf. Ser., 4841, 513 [Google Scholar]
- Bahcall, J. N. 1984, ApJ, 276, 169 [Google Scholar]
- Bailer-Jones, C. A. L., Rybizki, J., Andrae, R., & Fouesneau, M. 2018, A&A, 616, A37 [NASA ADS] [CrossRef] [EDP Sciences] [Google Scholar]
- Belousov, D. V., & Pavlov, A. K. 2024, Icarus, 415, 116066 [Google Scholar]
- Boehnhardt, H. 2004, in Comets II, eds. M. C. Festou, H. U. Keller, & H. A. Weaver, 301 [Google Scholar]
- Chambers, J. E. 1999, MNRAS, 304, 793 [Google Scholar]
- Chambers, K. C., Magnier, E. A., Metcalfe, N., et al. 2016, arXiv e-prints [arXiv:1612.05560] [Google Scholar]
- Cowan, J. J., & A’Hearn, M. F. 1979, Moon Planets, 21, 155 [NASA ADS] [CrossRef] [Google Scholar]
- Dandy, C. L., Fitzsimmons, A., & Collander-Brown, S. J. 2003, Icarus, 163, 363 [NASA ADS] [CrossRef] [Google Scholar]
- Dybczyński, P. A. 2001, A&A, 375, 643 [NASA ADS] [CrossRef] [EDP Sciences] [Google Scholar]
- Dybczyński, P. A., & Królikowska, M. 2025, A&A, 702, A143 [NASA ADS] [CrossRef] [EDP Sciences] [Google Scholar]
- Eggl, S., Farnocchia, D., Chamberlin, A. B., & Chesley, S. R. 2020, Icarus, 339, 113596 [NASA ADS] [CrossRef] [Google Scholar]
- Engrand, C., Lasue, J., Wooden, D. H., & Zolensky, M. E. 2024, in Comets III, eds. K. J. Meech, M. R. Combi, D. Bockelée-Morvan, S. N. Raymodn, & M. E. Zolensky, 577 [Google Scholar]
- Fray, N., & Schmitt, B. 2009, Planet. Space Sci., 57, 2053 [Google Scholar]
- Gaia Collaboration (Brown, A. G. A., et al.) 2018, A&A, 616, A1 [NASA ADS] [CrossRef] [EDP Sciences] [Google Scholar]
- Gaia Collaboration (Vallenari, A., et al.) 2023, A&A, 674, A1 [NASA ADS] [CrossRef] [EDP Sciences] [Google Scholar]
- Gronoff, G., Maggiolo, R., Cessateur, G., et al. 2020, ApJ, 890, 89 [Google Scholar]
- Guilbert-Lepoutre, A. 2012, AJ, 144, 97 [Google Scholar]
- Guilbert-Lepoutre, A., Davidsson, B. J. R., Scheeres, D. J., & Ciarletti, V. 2024, in Comets III, eds. K. J. Meech, M. R. Combi, D. Bockelée-Morvan, S. N. Raymodn, & M. E. Zolensky, 249 [Google Scholar]
- Gwyn, S. D. J., Hill, N., & Kavelaars, J. J. 2012, PASP, 124, 579 [NASA ADS] [CrossRef] [Google Scholar]
- Hainaut, O. R., & Delsanti, A. C. 2002, A&A, 389, 641 [NASA ADS] [CrossRef] [EDP Sciences] [Google Scholar]
- Heisler, J., & Tremaine, S. 1986, Icarus, 65, 13 [CrossRef] [Google Scholar]
- Høg, E., Fabricius, C., Makarov, V. V., et al. 2000, A&A, 355, L27 [Google Scholar]
- Holt, C. E., Knight, M. M., Kelley, M. S. P., et al. 2024, PSJ, 5, 273 [Google Scholar]
- Hui, M.-T., Farnocchia, D., & Micheli, M. 2019, AJ, 157, 162 [NASA ADS] [CrossRef] [Google Scholar]
- Hui, M.-T., Weryk, R., Micheli, M., Huang, Z., & Wainscoat, R. 2024a, AJ, 167, 140 [Google Scholar]
- Hui, M.-T., Wiegert, P. A., Weryk, R., et al. 2024b, ApJ, 975, L3 [Google Scholar]
- Hung, D., Tholen, D. J., Farnocchia, D., & Spoto, F. 2023, PSJ, 4, 215 [NASA ADS] [Google Scholar]
- Ishiguro, M., Jewitt, D., Hanayama, H., et al. 2014, ApJ, 787, 55 [Google Scholar]
- Jewitt, D. 2015, AJ, 150, 201 [NASA ADS] [CrossRef] [Google Scholar]
- Jewitt, D., & Meech, K. J. 1986, ApJ, 310, 937 [Google Scholar]
- Jewitt, D., Agarwal, J., Hui, M.-T., et al. 2019, AJ, 157, 65 [NASA ADS] [CrossRef] [Google Scholar]
- Jewitt, D., Kim, Y., Mutchler, M., et al. 2020, ApJ, 896, L39 [NASA ADS] [CrossRef] [Google Scholar]
- Jewitt, D., Kim, Y., Mutchler, M., et al. 2021, AJ, 161, 188 [NASA ADS] [CrossRef] [Google Scholar]
- Jordi, K., Grebel, E. K., & Ammon, K. 2006, A&A, 460, 339 [NASA ADS] [CrossRef] [EDP Sciences] [Google Scholar]
- Joye, W. A., & Mandel, E. 2003, in Astronomical Society of the Pacific Conference Series, 295, Astronomical Data Analysis Software and Systems XII, eds. H. E. Payne, R. I. Jedrzejewski, & R. N. Hook, 489 [Google Scholar]
- Kelley, M. S. P., Kokotanekova, R., Holt, C. E., et al. 2022, ApJ, 933, L44 [NASA ADS] [CrossRef] [Google Scholar]
- Królikowska, M., & Dybczyński, P. A. 2010, MNRAS, 404, 1886 [NASA ADS] [Google Scholar]
- Kulyk, I., Rousselot, P., Korsun, P. P., et al. 2018, A&A, 611, A32 [NASA ADS] [CrossRef] [EDP Sciences] [Google Scholar]
- Lacerda, P., Guilbert-Lepoutre, A., Kokotanekova, R., et al. 2025, A&A, 697, A210 [NASA ADS] [CrossRef] [EDP Sciences] [Google Scholar]
- Lang, D., Hogg, D. W., Mierle, K., Blanton, M., & Roweis, S. 2010, AJ, 139, 1782 [Google Scholar]
- Maggiolo, R., Gronoff, G., Cessateur, G., et al. 2020, ApJ, 901, 136 [NASA ADS] [CrossRef] [Google Scholar]
- Markwardt, C. B. 2009, in Astronomical Society of the Pacific Conference Series, 411, Astronomical Data Analysis Software and Systems XVIII, eds. D. A. Bohlender, D. Durand, & P. Dowler, 251 [Google Scholar]
- Markwardt, L., Wen Lin, H., Gerdes, D., & Adams, F. C. 2023, PSJ, 4, 135 [Google Scholar]
- Meech, K. J., & Jewitt, D. C. 1987, A&A, 187, 585 [NASA ADS] [Google Scholar]
- Moreno, F. 2022, Universe, 8, 366 [NASA ADS] [CrossRef] [Google Scholar]
- Nesvorný, D., Vokrouhlický, D., Dones, L., et al. 2017, ApJ, 845, 27 [CrossRef] [Google Scholar]
- Park, R. S., Folkner, W. M., Williams, J. G., & Boggs, D. H. 2021, AJ, 161, 105 [NASA ADS] [CrossRef] [Google Scholar]
- Raab, H. 2012, Astrometrica: Astrometric data reduction of CCD images, Astrophysics Source Code Library [record ascl:1203.012] [Google Scholar]
- Solontoi, M., Ivezić, Ž., Jurić, M., et al. 2012, Icarus, 218, 571 [CrossRef] [Google Scholar]
- Szabó, G. M., Ivezić, Ž., Jurić, M., & Lupton, R. 2007, MNRAS, 377, 1393 [CrossRef] [Google Scholar]
- Takada, M. 2010, in American Institute of Physics Conference Series, 1279, Deciphering the Ancient Universe with Gamma-ray Bursts, eds. N. Kawai, & S. Nagataki (AIP), 120 [Google Scholar]
- Tonry, J. L., Denneau, L., Flewelling, H., et al. 2018, ApJ, 867, 105 [NASA ADS] [CrossRef] [Google Scholar]
- Vereš, P., Farnocchia, D., Chesley, S. R., & Chamberlin, A. B. 2017, Icarus, 296, 139 [CrossRef] [Google Scholar]
- Vokrouhlický, D., Nesvorný, D., & Dones, L. 2019, AJ, 157, 181 [CrossRef] [Google Scholar]
- Waters, C. Z., Magnier, E. A., Price, P. A., et al. 2020, ApJS, 251, 4 [NASA ADS] [CrossRef] [Google Scholar]
- Whipple, F. L. 1950, ApJ, 111, 375 [NASA ADS] [CrossRef] [Google Scholar]
- Willmer, C. N. A. 2018, ApJS, 236, 47 [Google Scholar]
- Woodward, C. E., Rankin, D., Groeller, H., et al. 2025, Minor Planet Electronic Circulars, 2025-D83 [Google Scholar]
- Yeomans, D. K., Chodas, P. W., Sitarski, G., Szutowicz, S., & Królikowska, M. 2004, in Comets II, eds. M. C. Festou, H. U. Keller, & H. A. Weaver, 137 [Google Scholar]
Appendix A
Archival observations and viewing geometry of comet C/2025 D1 (Groeller)
All Tables
All Figures
|
Fig. 1 Selected archival observations of comet C/2025 D1 (Groeller). In some of the panels where the comet appears faint, a dotted white circle marks its location. The white and magenta scale bars represent an angular distance of 10′′ and a linear distance of 105 km projected at the observer-centric distance of the comet, respectively. J2000 equatorial north is up, and east is to the left. In each panel the antisolar direction (yellow arrow) and the projected negative heliocentric velocity of the comet in the observer’s sky plane (dark orange arrow) are also indicated. |
| In the text | |
|
Fig. 2 Temporal evolution of (a) apparent magnitude and (b) absolute magnitude of comet C/2025 D1 (Groeller), measured using a 3 × 10⁴ km radius aperture. The upper axes in panels (a) and (b) mark time with respect to the perihelion passage and heliocentric distance, respectively. Data from different facilities are plotted with distinct symbols, with colours corresponding to the bands to which the photometric reduction was calibrated (see the legends). The dotted lines in panel (b) represent the best-fit linear models to derive the colour indices and activity trends of the comet. |
| In the text | |
|
Fig. 3 Colour of C/2025 D1, measured using a 3 × 10⁴ km radius photometric aperture, compared with various small Solar System body populations (Dandy et al. 2003; Szabó et al. 2007; Solontoi et al. 2012; Jewitt 2015; Markwardt et al. 2023, and citations therein) and the Sun (Willmer 2018). The colours reported in non-SDSS systems are transformed to the SDSS system following Jordi et al. (2006). The open circles with letters at their centres represent main-belt asteroids of specific taxonomic types. The objects with linear reflectivity gradients in the g − i spectral interval form the reddening line, drawn as the dashed grey curve. |
| In the text | |
|
Fig. 4 Radial surface brightness profiles of comet C/2025 D1 on (a) 2 February 2022 from CFHT and (b) 30 May 2022 from HSC. These images have higher S/N for the comet than any other observations we collected. The azimuthally averaged surface brightness is plotted in olive green. The best-fit radial surface brightness model is shown as a dashed red line, with the derived logarithmic surface brightness slope indicated in the lower left corner. The boundaries of the fitted region are marked by the two vertical dashed blue lines. |
| In the text | |
|
Fig. 5 Orbit of C/2025 D1 at its previous perihelion, derived from the Monte Carlo clones. Left panel: orbital uncertainty in the space of perihelion time and distance. Right two panels: corresponding probability density distributions for each element. The nominal orbit is highlighted in orange. For the N-body integration, we adopted a local mass density in the solar neighbourhood of ρ∗ = 0.185 M⊙ pc−3 (Bahcall 1984). |
| In the text | |
Current usage metrics show cumulative count of Article Views (full-text article views including HTML views, PDF and ePub downloads, according to the available data) and Abstracts Views on Vision4Press platform.
Data correspond to usage on the plateform after 2015. The current usage metrics is available 48-96 hours after online publication and is updated daily on week days.
Initial download of the metrics may take a while.