Fig. 4
Download original image
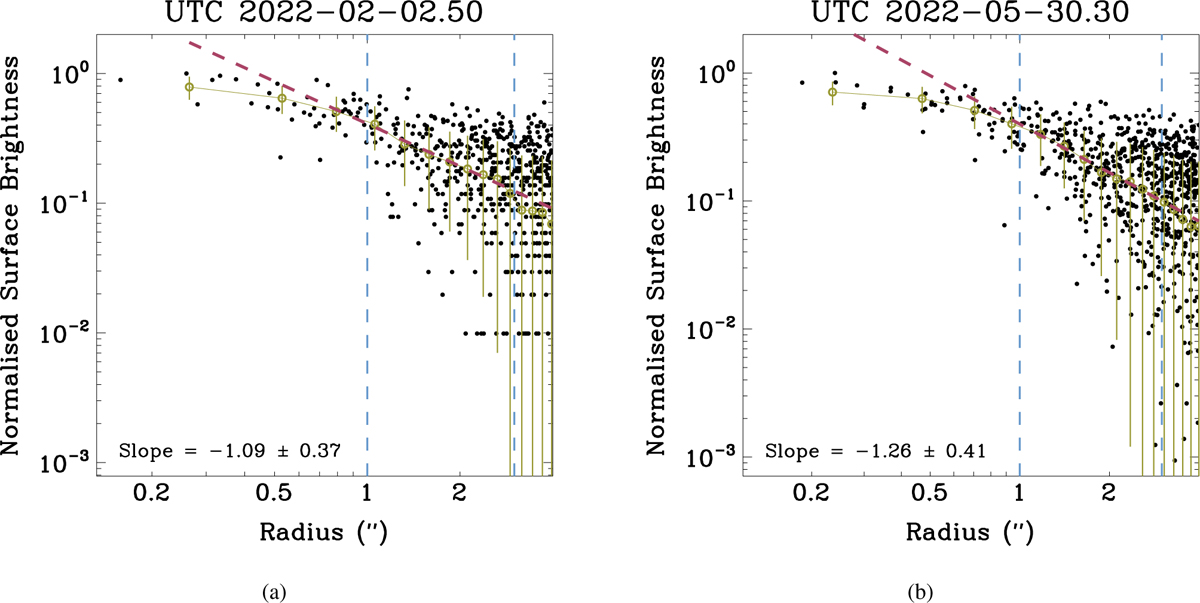
Radial surface brightness profiles of comet C/2025 D1 on (a) 2 February 2022 from CFHT and (b) 30 May 2022 from HSC. These images have higher S/N for the comet than any other observations we collected. The azimuthally averaged surface brightness is plotted in olive green. The best-fit radial surface brightness model is shown as a dashed red line, with the derived logarithmic surface brightness slope indicated in the lower left corner. The boundaries of the fitted region are marked by the two vertical dashed blue lines.
Current usage metrics show cumulative count of Article Views (full-text article views including HTML views, PDF and ePub downloads, according to the available data) and Abstracts Views on Vision4Press platform.
Data correspond to usage on the plateform after 2015. The current usage metrics is available 48-96 hours after online publication and is updated daily on week days.
Initial download of the metrics may take a while.