Fig. 2
Download original image
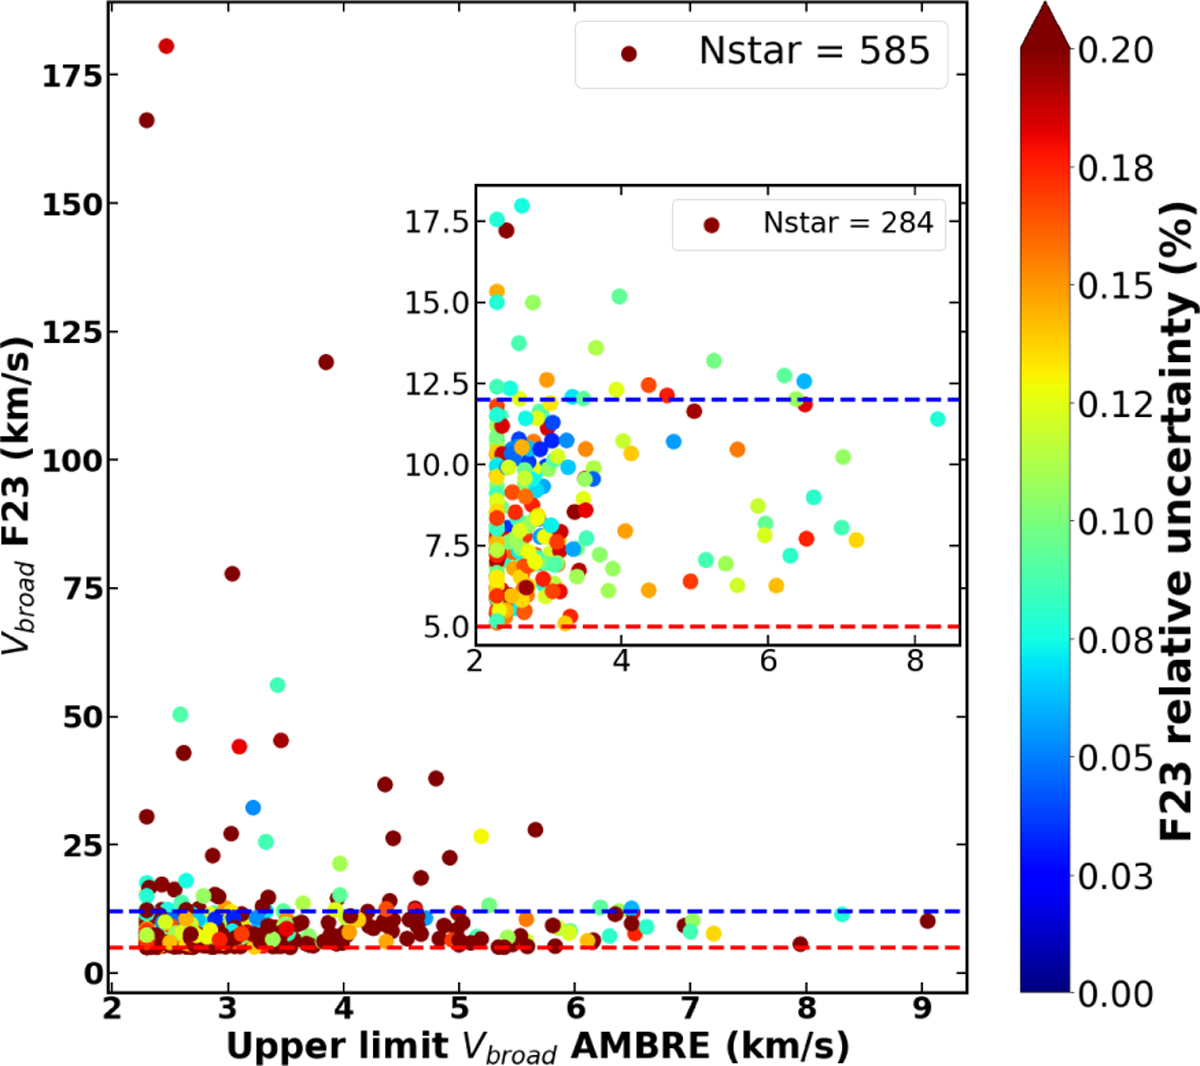
Comparison of the AMBRE/FEROS Vbroad upper limits with the measurements of Frémat et al. (2023), derived from Gaia/RVS DR3 spectra. The horizontal red and blue dashed lines refer to the F23 measurement limit and to their low- Vbroad domain, where overestimated values are suspected (5 and 12 km/s, respectively). The colour coding represents the F23 Vbroad relative uncertainty. The inset focuses on lowrotating F23 stars having a Vbroad relative uncertainty lower than 20%.
Current usage metrics show cumulative count of Article Views (full-text article views including HTML views, PDF and ePub downloads, according to the available data) and Abstracts Views on Vision4Press platform.
Data correspond to usage on the plateform after 2015. The current usage metrics is available 48-96 hours after online publication and is updated daily on week days.
Initial download of the metrics may take a while.