| Issue |
A&A
Volume 704, December 2025
|
|
|---|---|---|
| Article Number | A49 | |
| Number of page(s) | 11 | |
| Section | Catalogs and data | |
| DOI | https://doi.org/10.1051/0004-6361/202557176 | |
| Published online | 03 December 2025 | |
The AMBRE Project: Line-broadening and stellar rotation of ESO/FEROS archived spectra
1
Université Côte d’Azur, Observatoire de la Côte d’Azur, CNRS, Laboratoire Lagrange,
Bd de l’Observatoire,
CS 34229,
06304 Nice cedex 4,
France
2
Université Jospeh KI-ZERBO, Département de Physique, Laboratoire de Physique et de Chimie de l’Environnement,
03 BP 7021,
Ouagadougou,
Burkina Faso
★ Corresponding author: This email address is being protected from spambots. You need JavaScript enabled to view it.
Received:
9
September
2025
Accepted:
6
October
2025
Abstract
Context. Stellar rotation is a fundamental parameter in studies of the formation and evolution of stars. However, large homogeneous catalogues of rotational velocities derived from high-resolution stellar spectra are still lacking.
Aims. The main objective of this work is to determine the line-broadening parameter (Vbroad), which is a proxy for the stellar rotational velocity, in a large sample of FGKM stars based on their ESO/FEROS spectra. All these stars were previously parameterised by the AMBRE Project.
Methods. The line-broadening parameter was estimated by cross-correlating the FEROS spectra with binary masks, specifically chosen on the basis of the AMBRE stellar parameters. This methodology also relies on a specific calibration of a coupling constant between the rotational velocity and the width of the cross-correlation function. This fundamental step was performed by adopting the AMBRE grid of synthetic spectra. The derived Vbroad were then validated using data from the literature, ground-based spectroscopic surveys, and Gaia/RVS.
Results. After analysing more than 5000 FEROS spectra (including repeated spectra for several stars), we obtained the line-broadening coefficients for 2584 stars covering the FGKM spectral types, any stellar gravity, and metallicities between the metal-poor up to sub-solar regimes. The mean Vbroad relative uncertainty of this sample was found to be smaller than 8%. As expected, most stars were found to be slow rotators (below a few km/s), in particular, cool dwarfs and giants. However, several hot dwarfs and high-luminosity stars with high-Vbroad rates were identified, most of them not previously classified as fast rotators and/or affected by large macro-turbulent effects before the present work.
Conclusions. The measured rotational broadening values are of high-quality and verified on the basis of literature comparisons. We publicly provide this catalogue of line-broadening parameters, including stellar atmospheric and quality parameters, for the analysed AMBRE/FEROS sources.
Key words: line: profiles / catalogs / stars: rotation
© The Authors 2025
 Open Access article, published by EDP Sciences, under the terms of the Creative Commons Attribution License (https://creativecommons.org/licenses/by/4.0), which permits unrestricted use, distribution, and reproduction in any medium, provided the original work is properly cited.
This article is published in open access under the Subscribe to Open model. This email address is being protected from spambots. You need JavaScript enabled to view it. to support open access publication.
1 Introduction
The accurate determination of fundamental stellar parameters, including effective temperature, surface gravity, chemical composition, luminosity, mass, radius, and rotational velocity for large catalogues remains a significant challenge in astrophysics. However, recent advancements have been made, driven by large-scale spectroscopic surveys from the ground as the Gaia ESO Survey (Gilmore et al. 2012), AMBRE (de Laverny et al. 2013, see below), APOGEE (Majewski et al. 2017), and GALAH (De Silva et al. 2015) or from space, such as the European Space Agency (ESA) Gaia mission (Gaia Collaboration 2016) through its GSP-Spec catalogue (Recio-Blanco et al. 2023). Previously considered as a lower important parameter, stellar rotation is now recognised as playing a key role; for instance, it is crucial with respect to tracing a star’s structure and evolution (Maeder & Meynet 2000). It can also influence internal mixing, elemental diffusion, stellar winds, and magnetic field generation. For instance, horizontal branch stars in globular clusters are known to rotate at different rate, depending on their location on this branch (Recio-Blanco et al. 2002). Stellar rotation can also be considered as a chronometer, aiding in age determination through gyrochronology (Barnes 2007; Angus et al. 2015). Rotational velocity distribution of stellar populations can also provide valuable insights into star formation processes and evolutionary paths (Zorec & Royer 2012). Finally, understanding stellar rotation can help improve chemical enrichment models (Chiappini et al. 2003; Prantzos et al. 2018, 2020).
From the observational point of view, several studies have produced catalogues of stellar rotational velocities. First, we recall that the rotational velocity (Vsin i) is the product of the equatorial rotational velocity of the star by the sine of the inclination angle, i, between the star’s rotation axis and the observer’s line of sight. Then, it is worth noting that several of the published catalogues do not directly report Vsin i, but instead a line-broadening parameter (Vbroad) that is a good estimate of stellar rotation. The absorption lines present in any stellar spectra are indeed broadened by the combination of several physical mechanisms inherent to stellar atmospheres: the projected rotational velocity (Vsin i), the macro-turbulence velocity (Vmacro), and the micro-turbulence velocity (Vmicro). In most stars, Vbroad is dominated by Vsin i as soon as it is larger than a few km/s, but making a direct measurement of Vsin i from stellar spectra is not straightforward, since the other broadening mechanism have to be independently measured. Among the stellar rotation catalogues published before the era of large spectroscopic surveys, we could cite, for instance, the important works of De Medeiros et al. (2006, and previous studies on cool stars by the same group) and Glebocki & Gnacinski (2005). Regarding stellar rotation in hotter stars, we could cite Holgado et al. (2022); de Burgos et al. (2025, IACOB project, OB-type stars), Bragança et al. (2012, B-type dwarfs), or Zorec & Royer (2012, A-type stars). Then, large spectroscopic surveys as APOGEE, GALAH, and the ESA Gaia mission (Abdurro’uf et al. 2022; Buder et al. 2025; Frémat et al. 2023) published their own significant catalogues of stellar rotational rates. Most of these catalogues are detailed in Sect. 4 since they have been adopted to validate our measurements in this work. To complement such catalogues thanks to high-resolution spectra, the present work is aimed at measuring the spectral line broadening (Vbroad) of the FEROS spectra, previously parameterised by the AMBRE Project. Because of the large parameter space covered, this new catalogue delivers constraints on the rotational rate of different stellar types.
This article is structured as follows. The observational data considered in this work are described in Sect. 2. In Sect. 3, we present the methodology adopted to measure the line-broadening velocity in individual FEROS spectra. The AMBRE/FEROS catalogue of stars with measured Vbroad values is presented in Sect. 4 and compared to results from the literature in Sect. 5. Some rotational properties of the studied sample are discussed in Sect. 6, while we summarise our study in Sect. 7.
2 The AMBRE:FEROS data
The AMBRE Project consists of a stellar parameterisation and a Galactic Archaeology initiative led by the Observatoire de la Côte d’Azur (de Laverny et al. 2013). AMBRE has automatically parametrised a few 105 high-resolution stellar spectra collected by instruments of the European Southern Observatory (ESO). The extracted parameters include the radial velocities (VRad) and the main atmospheric parameters: Teff, log (g), [M/H], and enrichment in α-elements versus iron abundances, [α/Fe] (see Worley et al. 2012; De Pascale et al. 2014; Worley et al. 2016, for the analysis of FEROS, HARPS and UVES spectra, respectively). Moreover, the individual chemical abundances of various elements as, for instance, sulphur and lead, were also extracted (Perdigon et al. 2021; Contursi et al. 2024). Finally, AMBRE is also among the first efforts undertaken towards the automatic parameterisation of the million of spectra collected by the European Space Agency (ESA) Gaia mission (Recio-Blanco et al. 2023).
Regarding the spectra analysed in the present work, they were all collected with FEROS (Fiber-fed Extended Range Optical Spectrograph), an instrument mount on the MPG/ESO 2.2 m telescope. FEROS covers the ∼350 nm to ∼920 nm spectral range with a spectral resolution of R=48000 (Kaufer et al. 1999) and two wavelength samplings of 0.003 nm and 0.006 nm. Within AMBRE, Worley et al. (2012) analysed 21551 FEROS archived spectra, which correspond to 6285 different stars. Among them, 30.2% (∼3087 stars) received a complete parametrisation in Teff, log (g), [M/H] and [α/Fe]. Radial velocities (VRad) were determined for 56% of these FEROS spectra. The non-parametrised spectra correspond to instrumental issues, overly low signal-to-noise ratios (S/N) and/or overly low level of quality overall for the analysis. Moreover, some of these rejections concern hot and/or rapidly rotating stars incompatible with the reference grid adopted within AMBRE (de Laverny et al. 2012), which has been optimised for slow-rotating FGKM stars. Further details are available in Worley et al. (2012).
3 Determination of the line-broadening velocities
3.1 Adopted methodology
For the Vbroad determination within the AMBRE Project, a crosscorrelation function is computed between the FEROS spectra, S (λ), and a specific binary mask, M(λ). The binary masks consist of selected thin atomic lines and are generated from theoretical spectra representing the main expected absorption lines for a given stellar type. In the following, we adopted the masks specifically defined for AMBRE by Worley et al. (2012) for the determination of the radial velocities. More specifically, the spectrum emitted by a rotating star can be written as
 (1)
where H(λ) is the spectrum emitted by a non-rotating stellar surface and G(λ) is the rotational broadening function as described in Gray (2008), whose main parameter is the stellar rotation rate, Vsin i. Here, G(λ) also varies with the limb-darkening coefficient: the Claret (2000) values were adopted hereafter. The cross-correlation function with the adopted mask, M(λ), is
(1)
where H(λ) is the spectrum emitted by a non-rotating stellar surface and G(λ) is the rotational broadening function as described in Gray (2008), whose main parameter is the stellar rotation rate, Vsin i. Here, G(λ) also varies with the limb-darkening coefficient: the Claret (2000) values were adopted hereafter. The cross-correlation function with the adopted mask, M(λ), is
 (2)
which can also be expressed as a function of the velocity, v, as CCF(v). For computational efficiency and following (Worley et al. 2012), we restricted the integration interval to ± 500 km/s. Two velocity steps (∼2.22 or 4.44 km/s) for the integration of Eq. (2) were considered since two different setups are available for the FEROS spectra: either a wavelength sampling of 0.003 or 0.006 nm, respectively.
(2)
which can also be expressed as a function of the velocity, v, as CCF(v). For computational efficiency and following (Worley et al. 2012), we restricted the integration interval to ± 500 km/s. Two velocity steps (∼2.22 or 4.44 km/s) for the integration of Eq. (2) were considered since two different setups are available for the FEROS spectra: either a wavelength sampling of 0.003 or 0.006 nm, respectively.
Subsequently, we determined the CCF(v) minimum location (i.e. equivalent to a VRad measurement), adopting a Gaussian fitting. More importantly, the full width at half maximum (FWHMCCF and associated uncertainty) of this Gaussian was derived. It is proportional to the Vbroad that we want to determine, that is itself proportional to Vsin i (see the introduction and Recio-Blanco et al. 2004; Melo et al. 2001; Weise et al. 2010). These quantities are related via
 (3)
where A is a coupling constant that is specific to the considered spectral type (see Sect. 3.3). Moreover, σCCF is the width of the CCF, computed from
(3)
where A is a coupling constant that is specific to the considered spectral type (see Sect. 3.3). Moreover, σCCF is the width of the CCF, computed from  . Finally, σ0 corresponds to the CCF width for a non-rotating star and is therefore proportional to all the other broadening mechanisms, including the instrumental line spread function, except rotation.
3.2 Determination of σ0
The CCF widths for a non-rotating star (σ0) are specific to a given spectral type. They were derived by solving Eq. (3) for synthetic spectra computed without considering any rotation and mimicking FEROS observed spectra in terms of resolution and sampling. Thus, σ0 measures the mean spectral line broadening caused by intrinsic stellar effects (i.e. those inherent to the stellar atmosphere, independent of rotation) and instrumental effects.
For that purpose, we adopted the AMBRE synthetic spectra (de Laverny et al. 2012), which were first generated at very high spectral resolution (R=150 000), without radial or rotational velocities. They covered the wavelength range between 300 and 1200 nm with a step of 0.001 nm. A sub-sample of this large grid was selected for the present study in order to consider spectra representative of the AMBRE/FEROS parameters (FGKM-spectral types): 4000 K ≤ Teff ≤ 8000 K (step of 250 K); 1.0 ≤ log (g) ≤ 4.5 (step of 0.5 dex, g in cm/s2); −3.0 ≤[M/H] ≤+1.0 dex (step of 0.5 dex); as detailed in Table 2 of de Laverny et al. (2012). We also selected those spectra whose metallicity and α-element abundances satisfy the classical chemical pattern observed in the Milky Way: [α/Fe]=0.0 dex for [M/H] ≥ 0.0 dex; [α/Fe]=−0.4 ×[M/H] for −1.0 ≤[M/H] ≤ 0.0 dex, and [α/Fe]=+0.4 dex for [M/H] ≤−1.0 dex. We note that some combinations in the parameter space are not available, leading to the selection of 753 spectra (hereafter called AMBREVbroad).
To simulate ESO/FEROS spectrograph observations, these AMBREVbroad spectra were then subject to a two-step process. First, a Gaussian instrumental broadening was applied to match the FEROS resolution (R = 48 000), followed by a resampling at the two FEROS wavelength steps (0.003 nm and 0.006 nm). Finally, the σ0 were derived by computing the CCF(v) between each AMBREVbroad spectra and each mask of Worley et al. (2012). We selected the optimal mask for each spectrum by only considering the closest mask and spectrum parameters. We checked that the Gaussian fit of the 753 CCF(v) is well centred at 0 ± 2.5 km/s since the spectra are at rest. We also note that the selected σ0 were always found to be larger than the FEROS instrumental broadening which is estimated to be close to ∼2.3 km/s (corresponding to R = 48 000). The σ0 uncertainties were directly estimated from the FWHMCCF ones. The median of these σ0 relative uncertainties is 2.3% with a dispersion of 1.9%.
3.3 Determination of the coupling constants, A
Once the σ0 and their associated uncertainties are known, the determination of the coupling constant, A, first requires the computation of the σCCF. For that purpose, we applied a similar procedure as above, but considering rotating AMBREVbroad spectra, adopting 18 Vsin i values (of 1, 2, 4, 5, 7, 10, 13, 16, 20, 25, 30, 35, 40, 50, 60, 70, 80, and 100 km/s) for the G(λ) broadening function. The simulated rotating spectra (see Eq. (1)) were computed thanks to the PyAstronomy rotBroad function1. We then simulated FEROS-like spectra as above by considering the instrumental profile and sampling. The coupling constants were finally derived by fitting the (Vbroad−σCCF) relation of Eq. (3), using the scipy curve-fit method2. For the uncertainty estimation, we conducted a series of 1000 Monte Carlo (MC) simulations considering both the σ0 and σCCF uncertainties, deriving the A value for each of them. We then adopted for A the median of the distribution of all 1000 computed coupling constants, along with its uncertainty, which is half the difference between the 84th and 16th quantiles of the distributions (thereby corresponding to a 1−σ uncertainty for a Gaussian distribution).
We finally considered only the A coupling constants obtained when σCCF was estimated for at least half of the Vsin i values, ensuring a robust fit of Eq. (3). As above, we also retained only the cases for which the spectra parameters are the closest to the mask ones. This led to the derivation of 711 and 710 A-values for the 0.003 nm and 0.006 nm wavelength sampling, respectively. The median of their distribution is 2.02(1.99) with a dispersion of 0.42(0.44) for the 0.003 nm(0.006 nm) wavelength step. They are associated with relative uncertainties smaller than ∼3.12% with median values equal to 1.89% and a dispersion of 2.59%. An illustrative example is shown in Fig. 1 for the Solar case (Teff=5750 K, log (g)=4.5, [M/H]=0.0 dex., and [α/Fe]=0.0 dex).
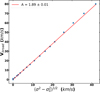 |
Fig. 1 Coupling constant of Eq. (3) for the Solar spectrum and a mask having exactly the same parameters (FEROS-like spectrum with a wavelength sampling of 0.003 nm). The A-value and its uncertainty are reported in the upper-left corner. |
3.4 Vbroad results for the A M B R E/F E R O S spectra
By applying Eq. (3), the spectral line broadening was computed for the 5448 FEROS spectra of Worley et al. (2012) having a published value for Teff, log (g), [M/H]3, excluding the overly cool (Teff ≲ 3500 K) or too hot (≳ 8000 K) ones and those with the lowest quality parameter parameterisation (AMBRE/CHI2_FLAG >1), since we could otherwise have ended up analysing them with a wrong mask. These spectra are associated to a σCCF relative uncertainty median value equal to 2.15% with a dispersion of 2.2%. For all of them, we adopted the most suitable mask (and therefore an A constant) by considering the closest mask and spectrum parameters, as already performed in Sect. 3.2. The uncertainties were again estimated thanks to a series of 1000 MC simulations, propagating the uncertainties on A, σ0, and σCCF. For several spectra, we found that σCCF ≃ σ0 (within error bars), revealing an overly slow rotating star to be measured with the FEROS instrumental resolution. We therefore adopted for these spectra a conservative Vbroad upper limit, defined as  , where εCCF is the error associated to σCCF, and checking to ensure that this value is always larger than the FEROS instrumental broadening. This procedure led to the determination of 2349 Vbroad values and 3099 upper limits. The median of the relative uncertainties (excluding the upper limits for which no uncertainties are estimated) is 8.1%, with a dispersion of 9.8%.
The AMBRE/FEROS catalogue of line-broadening velocities.
4 The AMBRE/FEROS catalogue of line-broadening velocities
The sample of 5448 spectra with a derived line-broadening velocity actually corresponds to a smaller number of stars, since several of them have been observed at different epochs. To build the AMBRE/FEROS catalogue of Vbroad, the first step was to carefully identify the star corresponding to each spectrum. For that purpose, we followed a similar procedure as in Santos-Peral et al. (2021) and identified the Gaia Data Release 3 (DR3) ID number for each source. We recovered the Gaia IDs of 5331 spectra corresponding to 2580 different stars. We also retained 117 other spectra that are associated with four other stars being too bright for having a Gaia ID and for which we adopted their Henry Draper (HD) identification. For the few remaining cases, we were not able to securely identify their corresponding star because of the rather low accuracy of the FEROS spectra coordinates. These were disregarded hereafter.
We recall that all these spectra have high-quality AMBRE atmospheric parameters as their parameterisations are associated to quality flag AMBRE/CHI2_FLAG values equal to 0 or 1. First, among them, 1957 stars have only one FEROS spectrum, and thus a unique computed Vbroad and associated uncertainty values. Secondly, 627 other stars have more than one derived Vbroad value because several repeat4 FEROS spectra were analysed for them. When two repeat spectra are available, we simply averaged the two derived Vbroad and uncertainty values, after having checked that the spectra S/N and parameterisation were close within each other. When more than three spectra were analysed for a given star, we applied a distance-weighted averaging method as in Adibekyan et al. (2015); Perdigon et al. (2021), assigning a larger weight to spectra with higher S/N. A similar procedure was adopted to compute the mean Vbroad uncertainties, the mean atmospheric parameters and the mean quality of the fit between the observed and the reconstructed synthetic spectrum at the AMBRE parameters ( , see Worley et al. 2012) for these stars with several repeat spectra.
All of this led to the Vbroad derivation for 2584 AMBRE/FEROS stars. Their AMBRE atmospheric parameters (as provided by Worley et al. 2012, or averaged with weighs in case of repeat spectra) together with their line-broadening velocity and associated uncertainty are provided in Table 1. We recall that no relative uncertainties are provided for upper limit values and, for these 1475 stars, the FEROS spectra S/N ratios could be considered for selecting the best quality estimates. We also recommend to adopt the fit quality ( ) to select the best data. Finally, 75% of stars with available uncertainty are associated to a relative error less than 10% (96% having a relative error less than 30%). Moreover, we warn that our Vbroad values are derived from the AMBRE atmospheric parameters (via the mask choice), which are assumed to be exact for the present study.
5 Comparison with the literature
The AMBRE/FEROS catalogue of line-broadening velocities is validated thanks to literature values, considering five main Vbroad catalogues. The cross-match between these catalogues and ours was made by adopting the Gaia DR3 or the HD (four stars) identifications. These comparisons are presented by decreasing number of stars in common between the AMBRE and literature catalogues.
5.1 Gaia DR3 line-broadening parameters
Frémat et al. (2023, F23, hereafter) measured the line broadening parameter (i.e. equivalent to our Vbroad) of about 3.5 million stars by analysing their Gaia’s Radial Velocity Spectrometer DR3 data (Cropper et al. 2018). Their huge catalogue is therefore based on spectra around the Ca II IR triplet lines. These spectra resolution (R ∼11 500) is much lower than the FEROS one and their sample is limited to GRVS<12. We found 1172 stars in common between F23 and our catalogue and we note that our relative uncertainties are always smaller than the F23 ones. For the stars in common, the FEROS (RVS) S/N have a mean equal to 95(361) and 1162(1130) stars are characterised by S/N>50. Only two stars have a FEROS S/N<40, but rejecting them did not change our conclusions, presented hereafter.
We first show in Fig. 2 a comparison between our upper-limit Vbroad values and the F23 measurements. For these 585 stars, it can be seen that most F23 stars are confirmed as slow rotators, in particular those with rather low relative uncertainties (inset). Our upper limits value are however always lower than the F23 values. This confirms the F23’s claim that their smallest values (below ∼12 km/s, blue dashed line in Fig. 2) are overestimated partly because of the rather low RVS spectral resolution. There are however some F23 stars with very high Vbroad values that are not compatible with our much lower upper limits. The most extreme cases (with Vbroad (F23) >70 km/s and all associated to rather F23 large relative uncertainties) are Gaia 3030262502952031616, 5201479762265799168, 3877936489933697408, and 5732039576302762496 having Vbroad(F 23) equal to 181, 166, 119, and 78 respectively, whereas our upper limits are lower than ∼4 km/s. For all these stars, we first checked that their FEROS and RVS spectra S/N are of rather high quality and that their AMBRE parameterisation is in agreement with literature values (when available), confirming the good choice determined when selecting the masks for Eq. (2). No peculiar information (spectral type and rotation) was found in the literature for the two first stars, although the first one could be a suspected binary belonging to the NGC 2423 open cluster. The third one is a known double or multiple star, according to CDS/Simbad5, for which Gaia identified only one source. Hence, its RVS spectrum could be affected by different stellar contributions leading to a possible suspicious Vbroad determination. Finally, Gaia 5732039576302762496 is a short period pulsating star, bright in X-rays, and, thus, with a possible complex spectrum that could have been poorly analysed.
Our Vbroad measurements without considering the upper limits are compared to F23 in Fig. 3. For clarity reasons, we only show in this figure all the high-quality measurements defined as having a Vbroad relative uncertainty less than 20% in both catalogues (in practice, this actually filters out almost exclusively F23 stars since our uncertainties are smaller). We note, however, that four stars are not shown in Fig. 3 because their Vbroad(F 23) ≫ 50 km/s. These extreme stars are commented hereafter and are not considered in the statistical comparison below. The global agreement looks good, in particular if we consider that (i) the F23 measurements below ∼12 km/s are probably overestimated (see discussion above) and (ii) the largest disagreements are found for the largest F23 uncertainties. The mean difference between both catalogues, considering the 332 stars with relative uncertainties less than 20% is indeed 3.8 km/s with a dispersion of 3.0 km/s. This corresponds to a mean relative difference of 33% and a relative dispersion of 22%. However, these numbers quickly increase when considering F23 stars with larger uncertainties: there are indeed 25 stars with Vbroad (F23) ≳50 km/s and relative uncertainties larger than 20% (with nine having an uncertainty larger than 40%).
Among the four stars not shown in Fig. 3 because of their large Vbroad(F 23) and with the other dozen having F23 relative uncertainties smaller than 40% (but departing by more than 40 km/s with respect to our determination), some suspicious values are present in one of the catalogues. Some of these cases could come from a wrong AMBRE parameterisation that led to a wrong choice of the mask for Eq. (2), but others could also be low-quality F23 determination. As example, we have identified among the most discrepant cases, Gaia 4946938113149426944 with Vbroad(F 23)=49.5 ± 10.7 km/s, whereas we have derived Vbroad=3.3 ± 1.1 km/s. The AMBRE stellar atmospheric parameterisation of this star fully agrees with previous determination (see, e.g. Costa-Almeida et al. 2021). Moreover, literature Vsin i values are found around ∼15 km/s, which strongly depart from F23, despite the fact they are still larger than ours. Actually, this star is a well known chromospheric active star. Since the RVS spectrum analysed by F23 is strongly dominated by the huge Ca II triplet lines, it is highly possible that the F23 measurement could have been affected by chromospheric effects in these line profiles. Finally, when examining its FEROS spectrum, a large Vbroad is excluded and we are therefore confident with our lower determination that relies much less on lines affected by the chromosphere thanks to the considered mask and the wider spectral domain studied. Moreover, the examination of the FEROS spectrum of Gaia 6054867464551287168 could reveal a binary component, affecting both the AMBRE and F23 determinations (5.3 and 234.6 km/s, respectively). The FEROS spectrum of Gaia 5935941572487329536 also exhibits some line core emission that could indicate some chromospheric activity, affecting more the F23 analysis. For this star, we however derived Vbroad=16.6 km/s in good agreement with (Torres et al. 2006, 20 km/s), contrary to Vbroad(F 23)=44.5 km/s. Similar chromospheric activities associated to very large (and, thus, suspicious) Vbroad(F 23) values are also seen in the spectrum of Gaia 4153657378750644864, Gaia 4114430411648869632 (our value being closer to the one of Torres et al. 2006), and Gaia 5369414461016305408 (our value being in good agreement with the one of Torres et al. 2006).
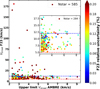 |
Fig. 2 Comparison of the AMBRE/FEROS Vbroad upper limits with the measurements of Frémat et al. (2023), derived from Gaia/RVS DR3 spectra. The horizontal red and blue dashed lines refer to the F23 measurement limit and to their low- Vbroad domain, where overestimated values are suspected (5 and 12 km/s, respectively). The colour coding represents the F23 Vbroad relative uncertainty. The inset focuses on lowrotating F23 stars having a Vbroad relative uncertainty lower than 20%. |
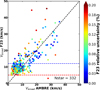 |
Fig. 3 Same as Fig. 2 but considering only AMBRE stars with a fully derived Vbroad (i.e. excluding upper limits) and high-quality measurements in both catalogues (Vbroad relative uncertainty less than 20%). The black-dashed line denotes the one-to-one relation for visual reference. For clarity, six extreme F23 stars with Vbroad>50 km/s are not shown (see text for details, including a discussion about the bias and dispersion associated to this comparison). |
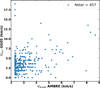 |
Fig. 4 Comparison of the AMBRE/FEROS upper limits Vbroad with the measurements of Glebocki & Gnacinski (2005). |
5.2 Glebocki & Gnacinski’s compilation of rotational velocities
The catalogue published by Glebocki & Gnacinski (2005, GG05, hereafter) is a compilation of projected rotational velocities (Vsin i6) published by various authors and collected between 1981 and 2000. The rotational information, that could be of rather heterogenous quality, are available for 28179 stars belonging mainly to 166 open clusters, globular clusters and associations. For each star, this catalogue provides the mean Vsin i value when several literature values are available. We found 746 stars in common between the GG05 and AMBRE/FEROS catalogues. For the comparison, we only considered their stars having a good quality flag (empty n_vsini flag), decreasing the comparison sample to 722 stars. Among them, 256 stars have a Vbroad (AMBRE) value, whereas 466 others have an upper limit estimation in the AMBRE/FEROS catalogue.
We first show in Fig. 4 a comparison of all our Vbroad upper limits with the GG05 values. Our estimates well confirm that most of these stars are slow rotators (below ∼10 km/s), as identified by GG05. We note, however, that no errors are provided by GG05 that could help to better understand the very few discrepant cases. For instance, two stars are not shown in this plot since their Vsin i (GG05) is larger than 20 km/s, whereas our upper limits are lower than a few km/s. One of them, Gaia DR3 5201129121134048768 (Vsin i(GG05)=29.9 km/s) is a known young star whose AMBRE parameters seem reasonable with respect to literature values. However, its complex spectrum that exhibits emission lines could have blurred one of the Vbroad determinations (or both). On the other hand, GG05 report for Gaia DR3 6207412157262342784 Vsin i values between 19 ± 6 and 38 km/s. According to CDS/Simbad, this is a chemically peculiar star with, again, a rather good AMBRE parametrisation. However, their lowest value, even considering its uncertainty, is marginally consistent with our upper limit.
Figure 5 illustrates the comparison with GG05 for stars with a fully derived AMBRE Vbroad (i.e. no upper values are included in this figure), and a Vbroad (AMBRE) relative uncertainty lower than 20%. A good agreement can be seen with a mean difference between both catalogues equal to 3.3 km/s and a dispersion close to 2.8 km/s. It can however be seen in this figure that the GG05 values seem to be quite often slightly smaller than ours. This could be an effect of the different definition of Vbroad and Vsin i : the macroturbulence velocity is indeed included in our estimates, contrarily to the GG05 ones that are believed (assumed) to be Vsin i values, without considering any other broadening mechanisms. Moreover, we note that two stars are not shown in Fig. 5 because of their large Vsin i (GG05). Among them, Gaia 5194203331750283392 has Vbroad(AMBRE)=34.7 km/s, whereas GG05 report a value ∼10 km/s larger. We note that its AMBRE stellar parameters are consistent with literature values found in CDS/Simbad. Additionally, Zúñiga-Fernández et al. (2021) published a rather low Vsin i, closer to ours (28 km/s), which could, thus, be favoured. Then, Vbroad(AMBRE)=26.3 km/s and Vsin i (GG05) =41.4 km/s for Gaia 5199981334076455680, whereas Zúñiga-Fernández et al. (2021) reported 34.1 km/s. The stellar parameters of this star should be explored (i.e. confirmation of the AMBRE values) to better define its actual rotational rate.
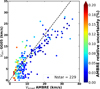 |
Fig. 5 Same as Fig. 4 but excluding the AMBRE/FEROS upper limits, and only considering AMBRE/FEROS high-quality measurements (relative uncertainties less than 20%; see the colour coding). The black-dashed line denotes the one-to-one relation for visual reference. See the text for a discussion about the bias and dispersion associated to this comparison. |
5.3 GALAH/DR4 rotational broadening
The GALAH project has published with its fourth data release a catalogue of about 918 000 stars with a rotational information (Buder et al. 2025). For the analysis of the observed spectra (R = 28 000), their reference synthetic spectra are computed without any rotational and macro-turbulent broadening, and were then broadened by different Vsin i values to estimate Vbroad.
In the absence of specific quality criteria for their Vbroad values, we adopted their quality flag (flag_sp) associated to the spectroscopic parameterisation. Only common targets with flag_sp =0 were thus retained in our analysis. We found 123 common stars; and 82 of them have flag_sp =0 and are considered hereafter. Among them, we have 43 AMBRE upper limits. We illustrate in Fig. 6 the comparison between their and our values for these 82 common stars. The agreement is rather good with a mean difference between both catalogues equal to 3.6 km/s and a dispersion of 3.7 km/s (not considering the 43 upper limits). Only two stars differ by more than ∼10 km/s. More precisely, the difference in Vbroad for Gaia DR3 6242687277719794176 and 5524839912881567232 is 12.1 and 17.5 km/s, respectively. The first one is a known K-type variable for which APOGEE published a Vbroad value between that of AMBRE and GALAH (Abdurro’uf et al. 2022). For the second one, the AMBRE and GALAH Teff differ by about 900 K and the Vbroad difference could then be explained by a misclassification in one of the two studies.
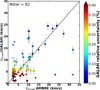 |
Fig. 6 Comparison of the rotational broadening AMBRE/FEROS Vbroad with the GALAH measurements of Buder et al. (2025). The black-dashed line denotes the one-to-one relation for visual reference. The colour coding represents the Vbroad (GALAH) uncertainty. Left-pointing triangles refer to the AMBRE upper limits. See text for a discussion about the bias and dispersion associated to this comparison. |
5.4 APOGEE/DR17 rotational broadening
The DR17 Apache Point Observatory Galactic Evolution Experiment (APOGEE) contains the rotational velocity of about 315 000 dwarf stars (Abdurro’uf et al. 2022), derived from spectra having a resolution of 22 500. Since their adopted methodology derived the combined rotational and macro-turbulent velocities, they can be directly compared to our Vbroad.
We identified 125 common stars between the APOGEE and AMBRE catalogues, but only 71 have an APOGEE rotational information associated to a reliable value, according to the APOGEE VSINI_WARN, ROTATION_WARN, and VSINI_BAD quality criteria. The remaining stars are shown in Fig. 7, with 46 of them having an AMBRE upper limit (triangles in the figure). Except for one star (discussed below), the agreement without considering AMBRE upper limit stars is excellent with a mean difference of 3.4 km/s, associated to a dispersion of 3.8 km/s. The star with the largest difference (about 20 km/s with Vbroad (APOGEE) =28.6 km/s) between APOGEE and AMBRE is Gaia 3216112884666365440. It is a known spectroscopic binary according to SIMBAD. Its APOGEE and AMBRE Teff and log (g) differ by about 500 K and 1 dex, respectively. It could therefore be that there is a misclassification in one of the catalogue that could explain the Vbroad disagreement.
The AMBRE upper limits are also in good agreement with the APOGEE values, except for four stars having a Vbroad (APOGEE) ≳ 10 km/s (among 42). One of them (Gaia 4126229541458375808 with Vbroad (APOGEE) =19.2 km/s) has a huge uncertainty (16.1 km/s) and could thus be in agreement with our upper limit value. The other three stars are: Gaia DR3 3265655023187142784, 3827985985921614080, and 3374633977170787072 with Vbroad (APOGEE) =13.5 ± 0.07, 14.4 ± 0.06 km/s, and 9.4 ± 0.26 km/s respectively, whereas we derived Vbroad ≲ 2.5 km/s for all of them. The first one has a AMBRE Teff hotter by about 400 K with respect to the APOGEE one, although other literature Teff are very close to ours, hence favouring our derived Vbroad. For the second one, the Teff differ by about 250 K but this would not explain the Vbroad difference, which origin is unknown. Finally, for the last star, we favour our low value since it was confirmed by Glebocki & Gnacinski (2005).
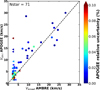 |
Fig. 7 Comparison of the rotational broadening AMBRE/FEROS Vbroad with the DR17 APOGEE measurements of Abdurro’uf et al. (2022). The black-dashed line denotes the one-to-one relation for visual reference. Left-pointing triangles refer to the AMBRE upper limits. The colour coding refers to the APOGEE relative uncertainties but most stars have overly small APOGEE uncertainties to see their error bars. See the text for a discussion about the bias and dispersion associated to this comparison. |
5.5 Rotational broadening of evolved stars from de Medeiros
The study of stellar rotation in evolved stars has strongly benefited from the pioneering works of de Medeiros & Mayor (1999); De Medeiros et al. (2002, 2004); De Medeiros et al. (2006, dM99, dM02, dM04, and dM06, hereafter). This series of papers provides databases for rotational velocities of evolved FGK stars. The observations were mostly collected with the CORAVEL spectrometer (R = 20 000, Baranne et al. 1979), enabling the measurement of Vsin i for a few thousands stars spanning luminosity classes Ib to IV.
We summarise in Table 2 the number of common stars between our catalogue and the de Medeiros ones. The rotational properties of the 47 common stars are compared in Fig. 8. The agreement between both measurements is very good with a mean difference of 3.83 km/s, associated with a dispersion of 3.68 km/s (not considering the upper limits). The most discrepant star is Gaia DR3 4156512638614879104 with Vsin i(dM)=20.4 km/s and Vbroad(AMBRE)=34.71 km/s, both having similar uncertainties close to ∼2 km/s. According to CDS/Simbad and Gaia, this is a single Cepheid variable. Its AMBRE atmospheric parameters are very close to those reported by Soubiran et al. (2022) with a difference of ∼150 K, 0.5 dex, and 0.3 dex in Teff, log (g), and [M/H] respectively; this is associated with a rather good  quality parameter for a S/N=75 spectrum. We are thus confident in our Vbroad determination.
Number of the AMBRE/FEROS Vbroad stars also found in the de Medeiros catalogues (no common stars were found with dM04).
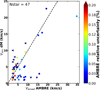 |
Fig. 8 Comparison of the rotational broadening of AMBRE/FEROS with the de Medeiros measurements. The black-dashed line denotes the one-to-one relation line for visual reference. The colour coding refers to the AMBRE relative uncertainties. Left and downward pointing triangles refer to the AMBRE and dM upper limits, respectively. See text for a discussion about the bias and dispersion associated to this comparison. |
5.6 Summary
This section presents our validation of our Vbroad determinations by comparing them with about 1800 other literature measurements. In particular, by comparing the AMBRE and Gaia/DR3 catalogues: (i) we confirm that most of the F23 Vbroad below ∼12 km/s are overestimated, (ii) both data sets agree within ∼4 km/s when considering F23 Vbroad with rather low relative uncertainties (more than 300 stars being considered), and (iii) some F23 stars with Vbroad ≳ 40 km/s are associated to rather large uncertainties that could be caused by chromospheric or binarity effects, preventing a proper derivation of Vbroad. The agreement with the GG05, APOGEE, GALAH, and the de Medeiros catalogues is also found to be good with again a mean difference of about 3.5 km/s.
Therefore, we concluded that the AMBRE/FEROS catalogue of rotational broadening is of high quality. We recommend to well consider the relative uncertainties and the different associated quality flags to define high-quality samples (see one example in the following section) to explore the stellar rotational properties.
6 Rotational properties of the AMBRE/FEROS stars
In this section, we illustrate some of the rotational properties of the AMBRE/FEROS catalogue, by first defining a sub-sample of stars with high-quality derived Vbroad. However, we again recall that our derived Vbroad include the rotational velocity plus all the other line-broadening processes. In particular, it is affected by the macro-turbulence velocity that is not estimated in the present work. We refer to the discussion of Frémat et al. (2023) about the difficulties to derive Vmacro from the RVS spectra. We also recall that typical Vmacro values are lower than ∼5 km/s in FGKM-type stars, increase with Teff, and they are lower for giant stars (Doyle et al. 2014). The line-broadening properties that can be derived from our catalogue could actually be dominated by macro-turbulence effects for the lowest Vbroad values (or upper limit ones).
Secondly, it is necessary to investigate if some binaries (or multiple stars) are present in our sample. The Vbroad derivation for such more complex spectra could indeed not be optimal with our adopted procedure. Moreover, the Gaia identification of the FEROS spectra could be affected by the rather low accuracy of the spectrograph coordinates and could lead to a mismatch in case of multiple stars. For that purpose, we considered, among the Gaia keywords, duplicated_source and non_single_star, which help to identify possible multiple stars. We found 281 stars in our catalogue with a true value for duplicated_source and 267 with a non_single_star keyword larger than zero. Finally, our sample of probable single stars (duplicated_source=false & non_single_star=0) contained 2067 objects, including three HD stars (among four) that are known to be single objects following CDS/Simbad7.
Then, we note that the best-quality Vbroad estimates could be selected by considering only the Vbroad uncertainties (however, they are not available for upper limit values) since they could be a good indicator of a wrong mask choice (and, hence, low-quality stellar parameters) or low-quality spectra. However, we favour a more global approach that can be applied to any star, even those with only upper limits estimates. For that purpose, we considered the  quality parameter and the FEROS spectra S/N values. By adopting
  simultaneously to the above-defined single star sample, we selected 1934 well parameterised stars with an estimated Vbroad (called the ‘High Quality’ subsample, hereafter, with this information provided in Table 1, in the last column). Among them, we have 1103 upper limit values and 831 with fully measured Vbroad values, associated to a mean Vbroad relative uncertainty smaller than 8% (there are 806 stars with a Vbroad relative uncertainty better than 30%).
To illustrate the properties of this High-Quality subsample, we show in Fig. 9 the Kiel diagrams of the selected stars colour-coded with their metallicity (top) and broadening velocities (bottom), separating the upper-limits and fully derived Vbroad values (left and right columns, respectively). It can be seen in these plots that most stellar evolution stages of the FGKM-stellar types have estimated Vbroad in our catalogue, which also covers a rather broad range of [M/H] values. First, we note that most upper-limit values are smaller than ∼5 km/s, which is a typical value of the macro-turbulence velocity for these stellar types (see above). Moreover, several stars with a fully derived Vbroad (bottom-right panel) have rather low Vbroad values. It can thus be estimated that most of these stars hardly rotate at all or at extremely low rotational velocities. Furthermore, the fastest rotators are found for the hottest dwarf stars, as already well known, and again shown in Fig. 10. These figures illustrate the Vbroad properties as a function of Teff and log (g), top and bottom panels, respectively. It is seen that most cool dwarfs and giants of our catalogue are predominately slow rotators. In particular, the cool giants characterised by rather low Vbroad values could result from rotational spin-down during post main sequence evolution. On the contrary, there are few metal-poor supergiants that exhibit larger Vbroad values (bottom-right panel of Fig. 10) that could be interpreted as large macro-turbulence effects and/or preserved main sequence rotation. Among them, we identified five HQ extreme hot supergiants (Teff>5500 K. and log (g)<1.5) with Vbroad>20 km/s. These Vbroad were measured with an error lower than 2 km/s and their metallicity was found to be between −1.3 and −0.4 dex (with classical [α/Fe] enrichment for Galactic stars). Three of them are known Cepheid variables with literature Vsin i slightly smaller than our Vbroad (which, however, includes Vmacro contrarily to Vsin i) and two are suspected postAGB without any known spectral information in the literature. Similarly, we found five HQ dwarf single stars (Teff>6000 K and log(g)>4.0) in our catalogue that exhibit rather high rotational rates (Vbroad>35 km/s, with very low uncertainties)8. Again, they are moderately metal-poor and none of them were previously known as a fast rotator, according to CDS/Simbad.
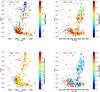 |
Fig. 9 Kiel diagrams for the AMBRE/FEROS High-Quality subsample. The left and right columns show stars with an upper limit Vbroad measurement and Vbroad determined with a relative accuracy better than 30%, respectively. The stellar metallicity and Vbroad are adopted for the colour coding (top and bottom, respectively). |
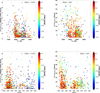 |
Fig. 10 Vbroad as a function of the effective temperature (top panels) and the surface gravity (bottom) for the AMBRE/FEROS High-Quality subsample. The left and right panels show stars with an upper-limit Vbroad measurement and Vbroad determined with a relative accuracy better than 30%, respectively. |
7 Summary
We present a catalogue of 2584 stars whose line-broadening coefficients (a parameter proportional to the stellar rotational velocity) were determined from high spectral resolution FEROS spectra. These stars were previously parameterised within the AMBRE Project. They have effective temperature within ∼3500 to ∼7500 K, stellar surface gravity between 1.0 and 5.0 and any metallicities between the metal-poor up to sub-Solar regimes. We recall here that our procedure to estimate the Vbroad values adopts the AMBRE atmospheric parameters, which are assumed to aptly characterise the stellar properties. This catalogue is also characterised by its high homogeneity for the observational data and whole analysis procedure (from the atmospheric parameter determination up to the line-broadening estimate).
This catalogue has been validated thanks to literature, ground-based spectroscopic surveys, and Gaia/RVS data. The agreement with the comparison samples is found to be good, confirming that the AMBRE/FEROS catalogue of rotational broadening is of high quality. For its use, we recommend considering the relative uncertainties and the different associated quality flags to define high-quality sub-samples to better explore the stellar rotational properties. As an example, by analysing the derived Vbroad uncertainties, the FEROS S/N, the AMBRE parameterisation qualities, and the possible binarity contamination thanks to Gaia data, we defined a sub-sample of about 1900 stars with high-quality Vbroad determinations. The associated mean Vbroad relative uncertainty is smaller than 8%. Checking literature parameterisation and/or spectral determination could also help to select the best Vbroad determinations. It is found that most AMBRE/FEROS stars are rather slow rotators although rather extreme Vbroad values are reported for a few dwarf and supergiant stars, most of them being unknown as fast rotators and/or affected by large macro-turbulent effects prior to the present work.
Finally, future studies will be devoted to the determination of the line-broadening coefficients of the HARPS and UVES spectra, already parameterised by the AMBRE Project (De Pascale et al. 2014; Worley et al. 2016, respectively). This should significantly increase the statistics of rotational information derived from high-spectral-resolution spectra for the FGKM stellar types.
Data availability
Full Table 1 is available at the CDS via https://cdsarc.cds.unistra.fr/viz-bin/cat/J/A+A/704/A49.
Acknowledgements
The AMBRE Project was financially supported by ESO, OCA, CNES, ANR, and INSU. PdL and ARB also acknowledge partial funding from the European Union’s Horizon 2020 research and innovation program under SPACE-H2020 grant agreement number 101004214 (EXPLORE project). FB acknowledges financial supports for his visits in Nice from the UniCa Erasmus+ International Mobility Program, the French Academy of Sciences, the J.-L. Lagrange Laboratory, the CNES support to the Gaia mission, and the EU H2020 Program. This work has made use of data from the European Space Agency (ESA) mission Gaia (https://www.cosmos.esa.int/gaia), processed by the Gaia Data Processing and Analysis Consortium (DPAC, https://www. cosmos.esa.int/web/gaia/dpac/consortium). Funding for the DPAC has been provided by national institutions, in particular the institutions participating in the Gaia Multilateral Agreement. We also used the IPython package (Pérez & Granger 2007), NumPy (Harris et al. 2020), Matplotlib (Hunter 2007), Pandas, TOPCAT (Taylor 2005) and the SIMBAD database, operated at CDS, Strasbourg, France (Wenger et al. 2000). Finally, the authors would like to warmly thank Mamadou N’Diaye and Eric Lagadec who initiated and made possible this collaboration between Ouagadougou and Nice.
References
- Abdurro’uf, Accetta, K., Aerts, C., et al. 2022, ApJS, 259, 35 [NASA ADS] [CrossRef] [Google Scholar]
- Adibekyan, V., Figueira, P., Santos, N. C., et al. 2015, A&A, 583, A94 [NASA ADS] [CrossRef] [EDP Sciences] [Google Scholar]
- Angus, R., Aigrain, S., Foreman-Mackey, D., & McQuillan, A., 2015, MNRAS, 450, 1787 [Google Scholar]
- Barnes, S. A., 2007, ApJ, 669, 1167 [Google Scholar]
- Baranne, A., Mayor, M., & Poncet, J. L., 1979, Vistas Astron., 23, 279 [NASA ADS] [CrossRef] [Google Scholar]
- Bragança, G. A., Daflon, S., Cunha, K., et al. 2012, AJ, 144, 130 [CrossRef] [Google Scholar]
- Buder, S., Kos, J., Wang, X. E., et al. 2025, PASA, 42, e051 [Google Scholar]
- Chiappini, C., Matteucci, F., & Meynet, G., 2003, A&A, 410, 257 [NASA ADS] [CrossRef] [EDP Sciences] [Google Scholar]
- Claret, A., 2000, A&A, 363, 1081 [NASA ADS] [Google Scholar]
- Contursi, G., de Laverny, P., Recio-Blanco, A., Palicio, P., & Abia, C., 2024, A&A, 683, A138 [NASA ADS] [CrossRef] [EDP Sciences] [Google Scholar]
- Costa-Almeida, E., Porto de Mello, G. F., Giribaldi, R. E., Lorenzo-Oliveira, D., & Ubaldo-Melo, M. L., 2021, MNRAS, 508, 5148 [Google Scholar]
- Cropper, M., Katz, D., Sartoretti, P., et al. 2018, A&A, 616, A5 [NASA ADS] [CrossRef] [EDP Sciences] [Google Scholar]
- de Burgos, A., Simón-Díaz, S., Urbaneja, M. A., et al. 2025, A&A, 695, A87 [NASA ADS] [CrossRef] [EDP Sciences] [Google Scholar]
- de Laverny, P., Recio-Blanco, A., Worley, C. C., & Plez, B., 2012, A&A, 544, A126 [NASA ADS] [CrossRef] [EDP Sciences] [Google Scholar]
- de Laverny, P., Recio-Blanco, A., Worley, C. C., et al. 2013, The Messenger, 153, 18 [NASA ADS] [Google Scholar]
- de Medeiros, J. R., & Mayor, M., 1999, A&AS, 139, 433 [NASA ADS] [CrossRef] [EDP Sciences] [Google Scholar]
- De Medeiros, J. R., Udry, S., Burki, G., & Mayor, M., 2002, A&A, 395, 97 [NASA ADS] [CrossRef] [EDP Sciences] [Google Scholar]
- De Medeiros, J. R., Udry, S., & Mayor, M., 2004, A&A, 427, 313 [NASA ADS] [CrossRef] [EDP Sciences] [Google Scholar]
- De Medeiros, J., Silva, J., Do NascimentoJr, J., et al. 2006, A&A, 458, 895 [NASA ADS] [CrossRef] [EDP Sciences] [Google Scholar]
- De Pascale, M., Worley, C. C., de Laverny, P., et al. 2014, A&A, 570, A68 [NASA ADS] [CrossRef] [EDP Sciences] [Google Scholar]
- De Silva, G. M., Freeman, K. C., Bland-Hawthorn, J., et al. 2015, MNRAS, 449, 2604 [NASA ADS] [CrossRef] [Google Scholar]
- Doyle, A. P., Davies, G. R., Smalley, B., Chaplin, W. J., & Elsworth, Y., 2014, MNRAS, 444, 3592 [Google Scholar]
- Frémat, Y., Royer, F., Marchal, O., et al. 2023, A&A, 674, A8 [NASA ADS] [CrossRef] [EDP Sciences] [Google Scholar]
- Gaia Collaboration (Prusti, T., et al.,) 2016, A&A, 595, A1 [NASA ADS] [CrossRef] [EDP Sciences] [Google Scholar]
- Gilmore, G., Randich, S., Asplund, M., et al. 2012, The Messenger, 147, 25 [NASA ADS] [Google Scholar]
- Glebocki, R., & Gnacinski, P., 2005, VizieR online data catalog, III [Google Scholar]
- Gray, D., 2008, The Observation and Analysis of Stellar Photosphere (Cambridge University Press) [Google Scholar]
- Harris, C. R., Millman, K. J., van der Walt, S. J., et al. 2020, Nature, 585, 357 [NASA ADS] [CrossRef] [Google Scholar]
- Holgado, G., Simón-Díaz, S., Herrero, A., & Barbá, R. H., 2022, A&A, 665, A150 [NASA ADS] [CrossRef] [EDP Sciences] [Google Scholar]
- Hunter, J. D., 2007, Comput. Sci. Eng., 9, 90 [NASA ADS] [CrossRef] [Google Scholar]
- Kaufer, A., Stahl, O., Tubbesing, S., et al. 1999, The Messenger, 95, 8 [Google Scholar]
- Maeder, A., & Meynet, G., 2000, ARA&A, 38, 143 [Google Scholar]
- Majewski, S. R., Schiavon, R. P., Frinchaboy, P. M., et al. 2017, AJ, 154, 94 [NASA ADS] [CrossRef] [Google Scholar]
- Melo, C., Pasquini, L., & De Medeiros, J., 2001, A&A, 375, 851 [NASA ADS] [CrossRef] [EDP Sciences] [Google Scholar]
- Perdigon, J., De Laverny, P., Recio-Blanco, A., et al. 2021, A&A, 647, A162 [NASA ADS] [CrossRef] [EDP Sciences] [Google Scholar]
- Pérez, F., & Granger, B. E., 2007, Comput. Sci. Eng., 9, 21 [Google Scholar]
- Prantzos, N., Abia, C., Limongi, M., Chieffi, A., & Cristallo, S., 2018, MNRAS, 476, 3432 [Google Scholar]
- Prantzos, N., Abia, C., Cristallo, S., Limongi, M., & Chieffi, A., 2020, MNRAS, 491, 1832 [Google Scholar]
- Recio-Blanco, A., Piotto, G., Aparicio, A., & Renzini, A., 2002, ApJ, 572, L71 [Google Scholar]
- Recio-Blanco, A., Piotto, G., Aparicio, A., & Renzini, A., 2004, A&A, 417, 597 [NASA ADS] [CrossRef] [EDP Sciences] [Google Scholar]
- Recio-Blanco, A., de Laverny, P., Palicio, P. A., et al. 2023, A&A, 674, A29 [NASA ADS] [CrossRef] [EDP Sciences] [Google Scholar]
- Santos-Peral, P., Recio-Blanco, A., Kordopatis, G., Fernández-Alvar, E., & de Laverny, P., 2021, A&A, 653, A85 [NASA ADS] [CrossRef] [EDP Sciences] [Google Scholar]
- Soubiran, C., Brouillet, N., & Casamiquela, L., 2022, A&A, 663, A4 [NASA ADS] [CrossRef] [EDP Sciences] [Google Scholar]
- Taylor, M. B., 2005, in Astronomical Society of the Pacific Conference Series, 347, Astronomical Data Analysis Software and Systems XIV, eds. P. Shopbell, M. Britton, & R. Ebert, 29 [Google Scholar]
- Torres, C. A. O., Quast, G. R., da Silva, L., et al. 2006, A&A, 460, 695 [NASA ADS] [CrossRef] [EDP Sciences] [Google Scholar]
- Weise, P., Launhardt, R., Setiawan, J., & Henning, T., 2010, A&A, 517, A88 [NASA ADS] [CrossRef] [EDP Sciences] [Google Scholar]
- Wenger, M., Ochsenbein, F., Egret, D., et al. 2000, A&AS, 143, 9 [NASA ADS] [CrossRef] [EDP Sciences] [Google Scholar]
- Worley, C. C., de Laverny, P., Recio-Blanco, A., Hill, V., & Bijaoui, A., 2016, A&A, 591, A81 [NASA ADS] [CrossRef] [EDP Sciences] [Google Scholar]
- Worley, C. C., de Laverny, P., Recio-Blanco, A., et al. 2012, A&A, 542, A48 [NASA ADS] [CrossRef] [EDP Sciences] [Google Scholar]
- Zorec, J., & Royer, F., 2012, A&A, 537, A120 [NASA ADS] [CrossRef] [EDP Sciences] [Google Scholar]
- Zúñiga-Fernández, S., Bayo, A., Elliott, P., et al. 2021, A&A, 645, A30 [NASA ADS] [CrossRef] [EDP Sciences] [Google Scholar]
Implemented in the SciPy library, see https://pyastronomy.readthedocs.io/en/latest/pyaslDoc/aslDoc/rotBroad.html
For the very few stars without an [α/Fe] estimate, we adopted the classical Galactic disc relation as in Sect. 3.2.
We recall that the AMBRE Project parameterised individual archive spectra and, for some stars, several spectra could have been collected, leading to several parameter sets.
These values, if really corresponding to Vsin i measurements (i.e. without the contribution of the macro-turbulence, for instance) for every star, could be lower than our Vbroad that also include other broadening mechanisms.
HD 128620 (α Cen A) being a spectroscopist binary has been excluded.
Almost 50 similar dwarfs have Vbroad>20 km/s.
All Tables
Number of the AMBRE/FEROS Vbroad stars also found in the de Medeiros catalogues (no common stars were found with dM04).
All Figures
|
Fig. 1 Coupling constant of Eq. (3) for the Solar spectrum and a mask having exactly the same parameters (FEROS-like spectrum with a wavelength sampling of 0.003 nm). The A-value and its uncertainty are reported in the upper-left corner. |
| In the text | |
|
Fig. 2 Comparison of the AMBRE/FEROS Vbroad upper limits with the measurements of Frémat et al. (2023), derived from Gaia/RVS DR3 spectra. The horizontal red and blue dashed lines refer to the F23 measurement limit and to their low- Vbroad domain, where overestimated values are suspected (5 and 12 km/s, respectively). The colour coding represents the F23 Vbroad relative uncertainty. The inset focuses on lowrotating F23 stars having a Vbroad relative uncertainty lower than 20%. |
| In the text | |
|
Fig. 3 Same as Fig. 2 but considering only AMBRE stars with a fully derived Vbroad (i.e. excluding upper limits) and high-quality measurements in both catalogues (Vbroad relative uncertainty less than 20%). The black-dashed line denotes the one-to-one relation for visual reference. For clarity, six extreme F23 stars with Vbroad>50 km/s are not shown (see text for details, including a discussion about the bias and dispersion associated to this comparison). |
| In the text | |
|
Fig. 4 Comparison of the AMBRE/FEROS upper limits Vbroad with the measurements of Glebocki & Gnacinski (2005). |
| In the text | |
|
Fig. 5 Same as Fig. 4 but excluding the AMBRE/FEROS upper limits, and only considering AMBRE/FEROS high-quality measurements (relative uncertainties less than 20%; see the colour coding). The black-dashed line denotes the one-to-one relation for visual reference. See the text for a discussion about the bias and dispersion associated to this comparison. |
| In the text | |
|
Fig. 6 Comparison of the rotational broadening AMBRE/FEROS Vbroad with the GALAH measurements of Buder et al. (2025). The black-dashed line denotes the one-to-one relation for visual reference. The colour coding represents the Vbroad (GALAH) uncertainty. Left-pointing triangles refer to the AMBRE upper limits. See text for a discussion about the bias and dispersion associated to this comparison. |
| In the text | |
|
Fig. 7 Comparison of the rotational broadening AMBRE/FEROS Vbroad with the DR17 APOGEE measurements of Abdurro’uf et al. (2022). The black-dashed line denotes the one-to-one relation for visual reference. Left-pointing triangles refer to the AMBRE upper limits. The colour coding refers to the APOGEE relative uncertainties but most stars have overly small APOGEE uncertainties to see their error bars. See the text for a discussion about the bias and dispersion associated to this comparison. |
| In the text | |
|
Fig. 8 Comparison of the rotational broadening of AMBRE/FEROS with the de Medeiros measurements. The black-dashed line denotes the one-to-one relation line for visual reference. The colour coding refers to the AMBRE relative uncertainties. Left and downward pointing triangles refer to the AMBRE and dM upper limits, respectively. See text for a discussion about the bias and dispersion associated to this comparison. |
| In the text | |
|
Fig. 9 Kiel diagrams for the AMBRE/FEROS High-Quality subsample. The left and right columns show stars with an upper limit Vbroad measurement and Vbroad determined with a relative accuracy better than 30%, respectively. The stellar metallicity and Vbroad are adopted for the colour coding (top and bottom, respectively). |
| In the text | |
|
Fig. 10 Vbroad as a function of the effective temperature (top panels) and the surface gravity (bottom) for the AMBRE/FEROS High-Quality subsample. The left and right panels show stars with an upper-limit Vbroad measurement and Vbroad determined with a relative accuracy better than 30%, respectively. |
| In the text | |
Current usage metrics show cumulative count of Article Views (full-text article views including HTML views, PDF and ePub downloads, according to the available data) and Abstracts Views on Vision4Press platform.
Data correspond to usage on the plateform after 2015. The current usage metrics is available 48-96 hours after online publication and is updated daily on week days.
Initial download of the metrics may take a while.