Open Access
Fig. D.1.
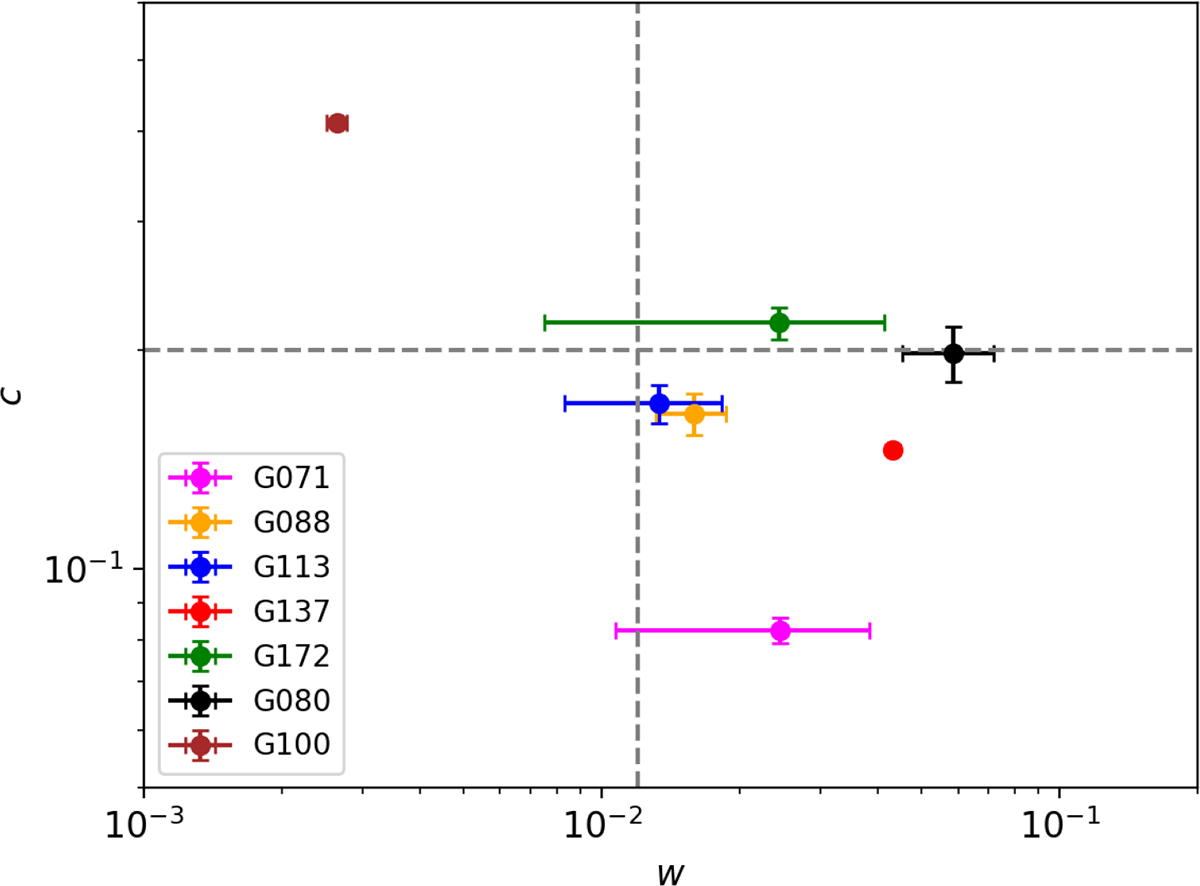
Download original image
Distribution of clusters with available X-ray data in the c − w diagram. The dashed lines are the reference values c = 0.2 and w = 0.012 as in Cassano et al. 2010. The clusters G080.41-33.24 and G100.45-38.42 are also reported (see details in Sect. 2).
Current usage metrics show cumulative count of Article Views (full-text article views including HTML views, PDF and ePub downloads, according to the available data) and Abstracts Views on Vision4Press platform.
Data correspond to usage on the plateform after 2015. The current usage metrics is available 48-96 hours after online publication and is updated daily on week days.
Initial download of the metrics may take a while.