| Issue |
A&A
Volume 704, December 2025
|
|
|---|---|---|
| Article Number | A245 | |
| Number of page(s) | 18 | |
| Section | Cosmology (including clusters of galaxies) | |
| DOI | https://doi.org/10.1051/0004-6361/202557181 | |
| Published online | 15 December 2025 | |
Resurging from the ashes: A spectral study of seven candidate revived radio fossils in nearby low-mass galaxy clusters
1
Istituto Nazionale di Astrofisica (INAF) – Istituto di Radioastronomia (IRA), Via Gobetti 101, 40129 Bologna, Italy
2
Dipartimento di Fisica e Astronomia (DIFA), Università di Bologna, Via Gobetti 93/2, 40129 Bologna, Italy
3
Center for Radio Astronomy Techniques and Technologies, Rhodes University, Grahamstown 6140, South Africa
4
Istituto Nazionale di Astrofisica – Istituto di Astrofisica Spaziale e Fisica cosmica (IASF), Via A. Corti 12, 20133 Milano, Italy
5
Thüringer Landessternwarte, Sternwarte 5, 07778 Tautenburg, Germany
6
Hamburger Sternwarte, Universität Hamburg, Gojenbergsweg 112, 21029 Hamburg, Germany
7
Istituto Nazionale di Astrofisica (INAF) – Osservatorio Astronomico di Padova (OAPD), Vicolo dell’Osservatorio 5, I-35122 Padova, Italy
8
Center for Astrophysics | Harvard & Smithsonian, 60 Garden Street, Cambridge, MA 02138, USA
9
ASTRON, The Netherlands Institute for Radio Astronomy, Postbus 2, 7990 AA Dwingeloo, The Netherlands
10
Kapteyn Astronomical Institute, University of Groningen, PO Box 800 9700 AV Groningen, The Netherlands
11
Anton Pannekoek Institute for Astronomy, University of Amsterdam, Postbus 94249 1090 GE Amsterdam, The Netherlands
12
Center for Advanced Interdisciplinary Research, Ss. Cyril and Methodius University in Skopje, 1000, Macedonia
13
Leiden Observatory, Leiden University, PO Box 9513 2300 RA Leiden, The Netherlands
14
Max-Planck-Institut für Extraterrestrische Physik (MPE), Gießenbachstraße 1, D-85748 Garching bei München, Germany
★ Corresponding author: This email address is being protected from spambots. You need JavaScript enabled to view it.
Received:
10
September
2025
Accepted:
7
October
2025
Abstract
Context. Complex energy transfer processes in the intracluster medium (ICM) can revive fossil plasma (with spectral ages ≫100 Myr) that was initially generated by radio galaxies. This leads to the re-ignition of faint radio sources with irregular and filamentary morphologies and ultra-steep (α ≳ 1.5) synchrotron spectra, which can more easily be detected at low frequencies (∼100 MHz). These sources offer the opportunity of investigating the microphysics of the ICM and its interplay with radio galaxies, the origin of seed relativistic electrons, the merging history of the host cluster, and the phenomenology of radio filaments.
Aims. The study of revived sources has been hampered so far by the requirement of sensitive and high-resolution multi-frequency radio data at low frequencies to characterise their spatial properties and provide a proper classification. We analysed a sample of candidate revived sources that were identified among nearby (z ≤ 0.35) and low-mass (M500 ≤ 5 × 10¹⁴ M⊙) Planck clusters in the footprint of the Second Data Release of the LOw Frequency ARray (LOFAR) Two Metre Sky Survey (LoTSS-DR2).
Methods. By inspecting LoTSS-DR2 images at 144 MHz, we identified seven targets with patchy and filamentary morphologies. They were followed-up with the upgraded Giant Metrewave Radio Telescope (uGMRT) at 400 MHz. By combining LOFAR and uGMRT data, we obtained high-resolution images and spectral index maps that we used to interpret the nature of the sources.
Results. All targets show regions with very steep spectra, which confirms the effectiveness of our morphology-based selection in identifying fossil plasma. Based on their morphology, spectral properties, and optical associations, we investigated the origin of the targets. We found a variety of promising revived fossil sources but also showed that apparently intricate structures can easily be misclassified in the absence of high-resolution and multi-band data.
Key words: radiation mechanisms: non-thermal / galaxies: clusters: intracluster medium / radio continuum: galaxies
© The Authors 2025
 Open Access article, published by EDP Sciences, under the terms of the Creative Commons Attribution License (https://creativecommons.org/licenses/by/4.0), which permits unrestricted use, distribution, and reproduction in any medium, provided the original work is properly cited.
This article is published in open access under the Subscribe to Open model. This email address is being protected from spambots. You need JavaScript enabled to view it. to support open access publication.
1. Introduction
Galaxy clusters form and evolve hierarchically via mergers. These events generate weak shocks and turbulence in the thermal intracluster medium (ICM) that dissipate a fraction of the merger energy into the non-thermal components of the ICM. Populations of pre-existing relativistic electrons (with a Lorentz factor of γ ∼ 100) can be re-accelerated by these shocks and turbulence and thus cause steep-spectrum (α ∼ 1 − 1.5) synchrotron diffuse emission on megaparsec scales in the form of radio relics (RRs) and radio haloes (RHs), respectively (e.g. van Weeren et al. 2019, for a review). The seed electrons are probably injected by active galactic nuclei (AGN), but the details of their origin and the energy transfer mechanisms operating in the ICM are not completely understood (e.g. Brunetti & Jones 2014; Vazza & Botteon 2024, for reviews).
In addition to RRs and RHs, more elusive, irregular, and filamentary diffuse sources that extend for a few hundred kiloparsecs and characterised by ultra-steep spectral indices (α ≳ 1.5) have been revealed in some galaxy clusters (e.g. Slee et al. 2001; Cohen & Clarke 2011; Shimwell et al. 2016; de Gasperin et al. 2017; Mandal et al. 2020; Raja et al. 2024; Shulevski et al. 2024; Rotella et al. 2025). These sources are thought to trace fossil lobes and tails of radio galaxies that have been revived by magneto-hydrodynamical processes in the ICM. As a result of synchrotron and inverse-Compton losses, the synchrotron spectrum of relativistic electrons in radio galaxies steepens at high frequencies (≳1 GHz), which means that they are only visible for a few hundred megayears after the jets switch off. If their fossil components gain energy, radio emission can be revived and detected at low frequencies (a few hundred megahertz), where they are much brighter because their spectrum is ultra-steep.
Examples of revived fossil sources are radio phoenices (RPs) and gently re-energised tails (GReETs), which are classified based on their morphological and spectral properties. RPs are patchy, irregular, and filamentary sources that extend for ∼100 − 300 kpc and exhibit an integrated ultra-steep spectral index that is spatially distributed across the source without a specific trend (e.g. Kempner et al. 2004; Kale et al. 2018; Mandal et al. 2020; Rahaman et al. 2022). They may trace re-ignition of old radio lobes from adiabatic compression after the passage of a shock wave (e.g. Enßlin & Gopal-Krishna 2001; Enßlin & Brüggen 2002; Nolting et al. 2019). GReETs likely consist of revived plasma from tailed radio galaxies, which include head-tail (HT), narrow-angle tail (NAT), and wide-angle tail (WAT) radio galaxies (e.g. Miley et al. 1972; Owen & Rudnick 1976). While a gradual spectral steepening with increasing distance from the core is observed along the tail, GReETs show a sudden constant brightness trend across hundreds of kiloparsec and a spectral flattening in regions of the tail that are thought to be gently, that is, inefficiently, re-energised by ICM turbulence (e.g. de Gasperin et al. 2017; Edler et al. 2022; Ignesti et al. 2022; Pasini et al. 2022; Gopal-Krishna & Wiita 2024; Lusetti et al. 2024).
Understanding the physics behind revived sources affects our view of the microphysics of the ICM and its interplay with radio galaxies, the injection and lifecycle of cosmic rays, and, ultimately, the dynamics and merging history of galaxy clusters. Work on diffuse radio sources in clusters has mostly been focused on RRs and RHs, whereas the study of RPs and GReETs has been hampered because sensitive high-resolution multi-frequency radio data at low frequencies are required to derive their spatially resolved spectral properties. In this respect, the Second Data Release of the LOFAR Two Meter Sky Survey (LoTSS-DR2; Shimwell et al. 2022) has enabled the study of a large variety of radio sources with unprecedented capabilities at low frequencies (120–168 MHz). We searched for promising revived fossils in a sample of nearby low-mass galaxy clusters in LoTSS-DR2, and investigated their spectral properties and nature with follow-up observations conducted with the upgraded Giant Metrewave Radio Telescope (uGMRT) at 300–500 MHz.
Throughout this paper, we adopt a standard ΛCDM cosmology with H0 = 70 km s−1 Mpc−1, ΩM = 0.3, and ΩΛ = 0.7. We adopt the convention on the spectral index α as defined from the flux density as S(ν)∝ν−α. The paper is organised as follows. In Sect. 2 we describe the selection criteria of our sample. In Sect. 3 we present the radio data and their processing. In Sect. 4 we report on the results of our analysis and discuss possible scenarios for the origin of the targets. In Sect. 5 we summarise our findings and future prospects.
2. Sample selection
Botteon et al. (2022) presented a sample of 309 galaxy clusters selected from the second Planck catalogue of Sunyaev-Zel’dovich detections (PSZ2; Planck Collaboration XXIV 2016) that are in the footprint of LoTSS-DR21. This represents the largest homogeneous sample of mass-selected galaxy clusters observed at radio frequencies to date. This sample was analysed in a series of works (Bruno et al. 2023; Cassano et al. 2023; Cuciti et al. 2023; Jones et al. 2023; Zhang et al. 2023) to derive the statistical properties of clusters with and without RHs and RRs and to test the predictions of theoretical formation scenarios. The project did not include the analysis of revived fossil sources because it lacked spectral measurements, which are essential for a proper classification.
We inspected the clusters of the sample to search for targets that might host revived fossil sources based on their irregular and filamentary morphology and the non-trivial connection with an optical host counterpart. In general, when no spectral measurements are available, the only a priori criterion to identify these sources is a visual inspection of their morphology. To avoid contamination from RHs and RRs that are also detected in some clusters, we only considered clusters classified as no diffuse emission (NDE, i.e., no detection of RRs or RHs) or uncertain (U, i.e., the detection of a diffuse source of unclear nature) as defined by Botteon et al. (2022). High-resolution spectral index maps are crucial for studying revived fossil sources, and we therefore set a redshift limit of z ≤ 0.35 that provides a spatial resolution ≲50 kpc at ∼10″. Currently, no firm relation between revived sources and the mass or dynamical state of the host cluster is known. We only considered low-mass systems with M500 ≤ 5 × 10¹⁴ M⊙. In this regime, the occurrence of RHs drops with respect to higher masses (e.g. Cassano et al. 2023), and the probability of possible contaminating emission is thus reduced.
We identified 9 promising revived sources in the 92 NDE and U clusters in the z and M500 ranges we considered out of 309 total entries. In 2 of these clusters, namely PSZ2 G080.41−33.24 (Cohen & Clarke 2011; Clarke et al. 2013) and PSZ2 G100.45−38.42 (Gitti et al. 2004; Gitti 2013; Kale & Gitti 2017; Ignesti et al. 2017, 2020), a revived source was confirmed in previous studies, and we excluded them from our sample. Therefore, we focus on the remaining 7 PSZ2 galaxy clusters here, which are G071.63+29.78 (G071), G088.53+41.18 (G088), G113.29−29.69 (G113), G137.74−27.08 (G137), G155.80+70.40 (G155), G165.68+44.01 (G165), and G172.74+65.30 (G172). Their properties are reported in Table 1. We focus on the radio sources within these clusters that are displayed in Fig. 1.
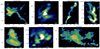 |
Fig. 1. Overview of the candidate revived fossil sources identified by visual inspection among low-z and low-M500 PSZ2 clusters in LoTSS-DR2 based on their irregular and filamentary morphology. |
Properties of the clusters hosting the candidate revived sources we analysed.
3. Observations and data processing
In this section, we summarise the LOFAR data processing. We then present the follow-up uGMRT observations of the targets and their processing.
3.1. LOFAR data
For details of the LoTSS-DR2 data reduction and post-processing, we refer to Botteon et al. (2022), Shimwell et al. (2022), and references therein. The details include the steps of direction-independent and direction-dependent calibration and additional self-calibration towards a smaller extracted portion of the field of view (see van Weeren et al. 2021 for details of this procedure). The typical noise level is σ ∼ 100 μJy beam−1 at the nominal resolution of θ ∼ 6″.
We re-imaged the extracted and self-calibrated visibilities with WSClean (Offringa et al. 2014; Offringa & Smirnov 2017) v. 3.6, using wide-field multi-frequency and multi-scale synthesis algorithms, and testing additional weighting schemes. The flux density scale of all images was aligned to the LoTSS-DR2 scale following Botteon et al. (2022) and Shimwell et al. (2022).
3.2. uGMRT data
Follow-up observations of the targets were carried out with the uGMRT in band 3 (300–500 MHz) between December 2023 and March 2025 (project codes 45_035 and 47_027; PI: L. Bruno) for ∼5.5 − 6.5 hours on-source each. The data were recorded in 4096 channels with a width of 48.8 kHz each. All observations included pointings (∼20 min) on 3C48 and/or 3C286, which were used as absolute flux-density scale calibrators.
We processed the data by means of the pipeline called source peeling and atmospheric modeling (SPAM; Intema et al. 2009). SPAM computes flux density and bandpass solutions for the calibrator that are then transferred to the target. Ionospheric effects are corrected by performing rounds of direction-dependent calibration by means of bright sources in the field. The total bandwidth was split into six (33.3 MHz) sub-bands that were processed independently and were afterwards recombined for imaging with WSClean using the same algorithms as are considered for LOFAR. The noise level is typically σ ∼ 25 μJy beam−1 at a resolution of θ ∼ 8″, but it can increase due to calibration artefacts around bright sources. In the next sections, we consider the noise level close to the target as reference.
3.3. Spectral index maps
A proper classification of the targets requires spatially resolved spectral index maps. We produced spectral index maps from LOFAR and uGMRT images obtained by matching the uv-range (60 λ – 35 kλ) to sample the same angular scales and convolved these images to a common resolution of 8″ − 10″. Regions with a surface brightness below a threshold of 3σ of each input image were masked, and the 144–400 MHz spectrum and errors were then computed pixel by pixel with the immath task of the code common astronomy software applications (CASA; McMullin et al. 2007) v. 6.4 as
 (1)
(1)
In Eq. (1), the uncertainties ΔS on the flux density are computed as
 (2)
(2)
where σ is the reference image noise, Nb is the number of independent beams within the target area, and ξcal is the systematic calibration error. We assumed standard calibration errors of ξcal = 10% for LOFAR (Shimwell et al. 2022) and ξcal = 6% for uGMRT in band 3 (Lal et al. 2022).
4. Properties and classification
In this section, we present the analysis of our targets. We show the LOFAR and uGMRT radio images in Figs. 2–8. The same figures include panels with optical images from the Panoramic Survey Telescope & Rapid Response System (Pan-STARRS; Flewelling et al. 2020) 144–400 MHz spectral index maps (see the corresponding errors maps in Fig. A.1 in Appendix A), and, if available, X-ray images. We used the optical images to search for host galaxies, whose redshifts are listed in Table C.1 in Appendix C; for details of the considered X-ray data, we refer to Botteon et al. 2022; Zhang et al. 2023 and Appendix D. In addition, we report the surface brightness and spectral index profiles in Appendix B to better interpret some targets.
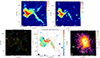 |
Fig. 2. Images of G071.63+29.78. Top: LOFAR at 144 MHz and uGMRT at 400 MHz radio images (units are Jy beam−1). The resolution and noise are reported at the top of each panel. The contour levels are [ ± 3, 6, 12, …] × σ. Bottom left: Pan-STARRS optical (composite i, r, g filter) image. The orange contours are from the radio images in the top panels. The green circles and cyan lines indicate optical sources and regions discussed in the text. Bottom centre: 144–400 MHz spectral index map (the error map is shown in Fig. A.1). The contour levels are [ ± 3, 6, 12, …] × σ from the 144 MHz image. Bottom right: X-ray image of the cluster. The green contours are from the LOFAR image. The red and black crosses indicate the Planck centre and X-ray peak, respectively. |
4.1. G071.63+29.78
The radio source in G071 (Fig. 2) consists of a main region with a patchy morphology that extends for ∼200 kpc and exhibits various brightness peaks. Three thin filaments are connected to this main region. The brightest of them, filament A, extends straight along the NE-SW axis for ∼250 kpc at 144 MHz, but it is only partially detected at 400 MHz. Interestingly, the surface brightness increases (or remains roughly constant) with the distance from the main region for ∼100 kpc and then rapidly drops for ∼150 kpc (Fig. B.1). In the northern region of the target, the two faint filaments B and C are only detected in the 144 MHz image (see also Fig. B.1), where we measured lengths of ∼130 kpc and ∼60 kpc, respectively. The surface brightness of filament B decreases in the initial ∼40 kpc, increases for ∼70 kpc, and finally drops (Fig. B.1).
The spectral index map shows a uniform distribution of α ∼ 2 across the main region, which confirms the ultra-steep spectrum nature of the source. A similar spectral index is measured along filament A, which exhibits a constant trend (at least for the initial 100 kpc). Filaments B and C are exclusively detected at 144 MHz, and we therefore expect α > 2.
By using the Pan-STARRS optical image and available redshift from the literature, we identified four cluster members (G1, G2, G3, and G4) close to the radio source that might be their host. None of these galaxies is co-located with a compact radio peak, which prevents us from determining a preferential host.
In the X-ray images, the radio source is located in the cluster outskirts at a projected distance of ∼900 kpc from the X-ray peak. The ICM shows no defined X-ray core, consistent with a disturbed dynamical state, as indicated by the morphological concentration and the centroid shift parameters (Table 1).
The amorphous and filamentary shape, the ultra-steep spectrum, and the non-trivial host galaxy are textbook features of radio phoenices. We therefore classify the source in G071 as a likely RP. Our target exhibits a uniform spectral index distribution, consistent with the existing variety of spectral behaviours reported for RPs (e.g. Mandal et al. 2020; Raja et al. 2024).
4.2. G088.53+41.18
The radio source in G088 (Fig. 3) is elongated and extends along the NW-SE axis for ∼730 kpc. Several regions (A-E) and a detached interesting radio source (S2) can be distinguished.
In regions A (LLS ∼ 120 kpc) and B (LLS ∼ 155 kpc), we observe a clear spectral gradient (Fig. B.2) as the spectral index progressively steepens from α ∼ 0.5 to α ∼ 2. The brightness peak of region A coincides with the cluster member galaxy G2. Based on these features and the overall morphology, we conclude that regions A and B are parts of a HT radio galaxy. The surface brightness profile (Fig. B.2) shows a transition that separates regions A and B and an enhancement of the brightness that peaks in the middle of the tail. This is unusual for tailed galaxies, but not unique (e.g. a similar structure has been observed for the HT radio galaxy T2 in A2142; Bruno et al. 2024), and it might be suggestive of interplay between the tail and the ICM.
Regions C (LLS ∼ 200 kpc) and D (LLS ∼ 100 kpc) are the faintest regions the target. Region C is elongated and characterised by a remarkably steep spectrum of α ≳ 3, as indeed it is only partially detected at 400 MHz, while region D is patchy and brighter, but exhibits a similar α ∼ 3. Interestingly, the surface brightness and spectral index are roughly constant in these regions (Fig. B.2). A compact radio source is located slightly offset with respect to regions C and D, but it is apparently connected to them. It is hosted by G1, which is the brightest cluster galaxy (BCG) in G088, and its radio emission is consistent with AGN activity. Region E (LLS ∼ 215 kpc) appears to be connected to region D, but the surface brightness abruptly increases and the spectral index flattens from α ∼ 3.5 to α ∼ 1.2. This spectral index is uniformly distributed throughout region E. The resolution of our radio images is sufficient to reveal an inner ring-like structure that is resolved out in the spectral index map, however.
Finally, we report on the radio source S2, which is located north-west of our main target. This is roughly orthogonal to the target and has an extent of LLS ∼ 200 kpc at the cluster redshift. A likely background galaxy, G3 (z = 0.172 ± 0.027), might be the host of S2. The spectral index is notably steep (α ∼ 2) and is approximately constant throughout the source.
The ICM shows a moderate core in X-rays, and the morphological parameters (see Appendix D) indicate some level of disturbance. The X-ray peak is offset from G1 by ∼100 kpc, and the eastern boundary of the core appears to be spatially coincident with the radio emission of regions C and D. This suggests a possible connection between thermal and non-thermal components. Overall, the target extends along the cluster major axis, while S2 is located in the outskirts.
We interpret regions A and B as components of a HT radio galaxy, as described above. The measured ultra-steep spectrum confirms that regions C and D consist of fossil plasma. If they are physically associated with the AGN of the BCG, regions C and D may trace remnant plasma that has drifted apart due to buoyant forces or cluster weather. The relatively flat spectral index (α ∼ 0.7) of the AGN differs from an aged source, however. Therefore, either the fossil components originated from a previous AGN outburst phase or the association is a projection effect. We note that the spectral index profile is discontinuous at the transition between regions B and C (Fig. B.2). This spectral profile shows similarities to that of the prototypical GReET in A1033 (de Gasperin et al. 2017; Edler et al. 2022). Specifically, in A1033, a spectral flattening was reported, whereas in regions C and D of our target, we do not observe a clear flattening, but rather a very slow steepening with the distance that results in a plateau around α ∼ 3 − 3.5. An alternative explanation therefore is that regions C and D are powered by re-energised fossil electrons that are released by the HT radio galaxy. The constant brightness profile (Fig. B.2) supports this interpretation, and, considering the spatial coincidence, the gentle re-acceleration might be induced by processes involving the X-ray core region, likely due to weak turbulence, whose lower efficiency compared to A1033 would explain the spectral plateau instead of a flattening. The ring-like morphology of region E is reminiscent of a WAT radio galaxy, but the absence of a spectral gradient and obvious host challenges this interpretation. If S2 is hosted by G3, it might be a HT radio galaxy; if not, its location and orientation suggest that S2 may be an RR. The two hypotheses are strongly disfavoured by the observed uniformly distributed ultra-steep spectrum, however. While the nature of region E and source S2 remains to be understood, we confidently claim that they are unrelated to the HT and candidate GReET emission.
4.3. G113.29-29.69
The radio source in G113 (Fig. 4) has a roughly triangular shape with a length of ∼150 kpc. In the LOFAR image, we detect a secondary blob west of the main structure, which is revealed to be a system of multiple filaments of similar length (∼60 kpc) that intersect at the position of a local radio peak (the node) in the uGMRT image. As the 144 and 400 MHz images have a similar resolution, the apparent discrepancy of the morphology of low-surface brightness regions is likely due to the lower quality of the LOFAR data in the direction of the target.
The spectral index map shows patches of steeper and flatter regions ranging in α ∼ 1 − 1.8. Within the errors, the spectral index distribution is roughly uniform, however, with a mean value of α ∼ 1.3. The average spectrum of the filaments is consistent with this mean value, but the current data quality prevents us from determining accurate measurements at high resolution.
Several compact radio peaks that are best imaged at 400 MHz are detected in the main region and filaments. Of these, only the brightest peak is associated with a galaxy (G1) in the optical image, but its high spectroscopic redshift (z = 0.125 against z = 0.107 for G113) suggests that it might not be a cluster member. The other galaxies (G2, G3, and G4) that we identified are not co-located with specific regions of the radio source.
The ICM is elongated in the X-rays, but exhibits a bright core. The morphological parameters locate the cluster in between relaxed and merging systems. The radio source lies in the northern cluster outskirts at a projected distance of ∼500 kpc from the X-ray core.
The properties of the radio source in G113 are similar to those observed for the candidate RP in G071 (Sect. 4.1): overall morphology, location in the cluster outskirts, uncertain association with a host galaxy, and steep-spectrum fossil emission. There is no clear evidence of re-energising (e.g., constant trends in brightness or spectral index), however, and the average spectral index is not as ultra-steep as is typically observed in RPs. Therefore, we consider it as a remnant, although the possibility of a RP cannot be completely ruled out considering the overall similarities with RPs.
4.4. G137.74−27.08
A multi-wavelength analysis of the galaxy cluster G137.74−27.08 has recently been carried out by Whyley et al. (2025). Specifically, these authors included deep narrow-band GMRT observations at 325 MHz. Our wide-band uGMRT data, with a similar on-source observing time, allowed us to improve the rms noise close to the target by a factor of ∼1.4.
The candidate revived source in G137 (Fig. 5) has a complex morphology. The main structure recalls a Fanaroff-Riley I (FRI; Fanaroff & Riley 1974) radio galaxy with S-shaped jets, labelled regions A and B, which departs from a central compact radio source hosted by the galaxy G1 (G5 in Whyley et al. 2025). A filament appears to be connected to the putative jets. The spectral index is approximately constant throughout the whole source, and α = 1.4 ± 0.1 is consistent with the integrated spectrum reported by Whyley et al. (2025).
Properties and (tentative) classification of the analysed radio sources.
The Pan-STARRS image shows that G1 shares a stellar envelope with two bright galaxies, G2 and G3 (G4 and G3, respectively, in Whyley et al. 2025), suggesting merging activity. Galaxies G2 and G3 are co-spatial with the local radio peaks of region B, but the resolution is not sufficient to distinguish whether only one or both of them emit in the radio. In this respect, we note that the Karl G. Jansky Very Large Array Sky Survey (VLASS; Lacy et al. 2020) reports no detection of radio activity from G1, G2, and G3 at a threshold of 3σVLASS = 210 μJy beam−1 (see Fig. E.1 in Appendix E). The merging nature of the cluster is confirmed by the X-ray data. Interestingly, Whyley et al. (2025) reported the detection of a shock towards the region of our target at a distance of ∼200 kpc from the cluster centre. These authors thus interpreted the radio source as resulting from adiabatic compression of its lobes triggered by the shock passage. In the top right panel of Fig. 5, we show a higher-resolution LOFAR image of G137, and in Fig. B.3, we show the corresponding surface brightness profile. These images suggest alternative scenarios that we discuss below.
In the first scenario, regions A and B are radio lobes of a single radio galaxy, and G1 is its host. This is supported by the similar integrated spectra and radio powers of the two regions (see Table 2). The S-shaped morphology can be driven by jet precession induced by G2 and G3. The absence of a global spectral gradient and the ultra-steep spectrum cannot be easily reconciled with a single radio galaxy, however.
In the second scenario, regions A and B are independent sources, specifically a HT (hosted by G1) and a WAT (hosted by either G2 or G3) radio galaxy, respectively. Interestingly, in the high-resolution image, the filament appears to be the terminal part of the western jet of the WAT rather than being associated with region A. The surface brightness and spectral index profiles (Fig. B.3) support the WAT classification and suggest that G3 is its host. The surface brightness peaks at the position of G3 and decreases along the two putative bent jets, and the spectral index steepens farther away from G3. The filament can be explained when we assume that the WAT drifts southward, which leaves electrons behind (see e.g. the WAT 111 in Ophiuchus for a similar case; Botteon et al. 2025; Cotton et al. 2025). On the other hand, the brightness increases overall, and the spectral index is roughly constant in region A. This challenges the simple HT scenario.
In the third scenario, the merging event involving G1, G2, and G3 causes the observed radio emission. The collision of these galaxies induced re-energising of fossil electrons and reshaped the radio source via ICM shocks and/or turbulence.
It is challenging to confirm a preferential scenario, but current data favour the WAT plus filament interpretation for region B. We note that the surface brightness profile fluctuates around a constant value over a length of ∼130 kpc along the filament, whereas its spectrum gradually steepens (although spectral measurements can be biased by the lower resolution of the spectral index map). Constant and enhanced brightness, as observed for region A and the filament, and a flat spectral trend, as observed for region A, are indicative of an ongoing re-energising of aged electrons and/or amplification of the magnetic field. The nature of the radio source in G137 remains uncertain, however, and this is a clear caution against a simple classification as RP or GReET based on limited information.
4.5. G155.80+70.40
No X-ray data of G155 are available, and the optical images reveal no dominant member galaxy. Therefore, it is challenging to determine the position of the radio source in G155 (Fig. 6) with respect to the cluster centre. Considering the Planck centre, the target lies at a projected distance of ∼400 kpc. The radio source in G155 is diffuse and exhibits multiple radio peaks. We distinguished two regions within the source.
Within region A, the two radio peaks are co-spatial with the cluster member galaxies G1 and G2, which have a projected separation of ∼300 kpc. The spectral indices at the location of the radio peaks are α ∼ 1 and α ∼ 0.6 for G1 and G2, respectively. As shown by the spectral index profile (Fig. B.4), we measured a gradual steepening from G2 towards G1.
Region B encloses the diffuse southern emission of the target. It has a size of ∼450 kpc, as measured E-W. The radio peak is co-spatial with G3, a non-cluster member galaxy at high redshift (z = 0.687, Table C.1). Our uGMRT image only recovers the brightest emission of this region (inner ∼150 kpc), where we measured a remarkably ultra-steep spectral index of α ∼ 2.7. The undetected emission at 400 MHz is expected to have an even steeper spectrum.
The spectral information that we obtained provides crucial indications on the nature of the target. The spectral profile suggests that G2 is the host of a HT radio galaxy that moves southwards. This scenario is confirmed by the LOFAR image at higher resolution, which reveals unresolved radio jets that depart east and west from the northern region of G2, which agrees with the expected deflection towards the north. Notably, this image shows a sharp transition of the tail, which is abruptly deflected from N-S to NW-SE. Similar transitions are becoming common in tailed radio galaxies, with NGC 4869 in the Coma cluster (Lal 2020) being a prototypical example, and they may originate from the interaction with the ICM. As is typical for tailed galaxies, the surface brightness decreases with the distance from the core (Fig. B.4), but this decline is slowed down during the transition.
Region B is amorphous and has an ultra-steep spectrum, which confirms its fossil nature. It is unlikely that G3 is its host because this would require a chance alignment between our target and an high-z remnant source. A plausible explanation is that region B traces remnant emission from a previous AGN activity phase (possibly of G1, considering its steep spectrum).
4.6. G165.68+44.01
The radio source in G165 (Fig. 7) consists of two apparently connected regions with a similar ellipsoidal shape and size (∼250 kpc). The LOFAR image at θ = 5″ × 3″ resolution reveals different internal structures, however. Region A (in the north) exhibits a clear C-shaped structure, and region B (in the south) consists of filamentary components.
C-shaped morphologies are typical of WAT radio galaxies, but there is no evidence of a radio core within region A that can confirm this interpretation. We only identified a compact radio source that is associated with the galaxy G1, but it is largely offset from the putative jet bending point, and its photometric redshift (z = 0.302 ± 0.047) suggests that it is a background source. Similarly, the filamentary components of region B might be interpreted as bent radio jets from a tailed galaxy that is seen almost edge-on, but we do not observe any potential radio core. The spectral index map shows that regions A and B both consist of ultra-steep spectrum emission, and, although the distribution is not uniform, there are no gradients, which would be expected if they were tailed radio galaxies. The integrated spectral indices are α ∼ 1.5 and α ∼ 1.8 for regions A and B, respectively, but this difference is not particularly significant within the errors, and it is mostly driven by a flatter-spectrum patch (α ∼ 1.1) and a steeper-spectrum patch (α ∼ 2.3) at the eastern and western edges of the two regions, respectively.
The location of the target within the cluster is unclear. The Chandra X-ray image (see also Appendix D) is not sufficiently deep, but it shows the tentative detection of diffuse emission both close to the Planck centre, where a WAT radio galaxy (see overlaid contours) is located, and co-spatial with the target radio source. In the optical, the same regions are occupied by several member galaxies gathered around dominant galaxies of similar magnitudes. The projected distance of the two dominant galaxies of the systems, and analogously, of the X-ray patches, is ∼670 kpc. Therefore, the cluster centre is largely uncertain, and G165 might consist of two main groups rather than a single system.
In summary, our analysis is inconclusive on the nature of the radio emission in G165. Regions A and B consist of fossil plasma, but it is unclear whether this is associated with a single remnant or two distinct remnants. None of them is clearly associated with an optical host, and the X-ray information is inadequate. Deeper X-ray data are necessary to investigate the thermal emission in G165 and its dynamical state, with important implications for the interpretation of the target. In this respect, we cannot rule out possible interplay with the ambient medium; for instance, the complex internal structures may arise from reprocessed fossil emission by the cluster (or group) weather (see a similar case in the group NGC 507; Brienza et al. 2022).
4.7. G172.74+65.30
The bright target at the centre of G172 (Fig. 8) has an impressively complex diffuse morphology with multiple brightness peaks and gaps, inner filaments, and arc-shaped regions. The limited dynamic range causes artefacts around the source that are not easily distinguishable from real (low surface brightness) emission; for instance, region E might be an artefact.
The X-ray image reveals an elongated and disturbed system lacking an X-ray core. The merging nature of the cluster is confirmed by the two brightest galaxies G1 and G2, separated by a projected distance of ∼120 kpc, and both are active in the radio band. The radio emission associated with G2 has a roundish morphology that extends for ∼30 kpc, whereas G1 is associated with the peak emission of region A. In the higher-resolution LOFAR image, the structure of region A is resolved and reveals that it is a NAT radio galaxy with a distinguishable core and bent jets (see also the VLASS image in Fig. E.2 in Appendix E). The average spectral indices of the emission associated with G1 and G2 are α ∼ 0.7, which is typical of radio galaxies.
Our LOFAR and uGMRT images at ∼6″ suggest a possible physical connection between the NAT (region A) and regions B and C via filamentary structures. The high-resolution LOFAR image supports this hypothesis. The jets of the NAT appear to be twisted, with one of the two jets (‘jet 1’ in Fig. E.2) first bent towards the west and then towards the east, in the direction of region C. In this scenario, region B might represent the western part of the tail, produced by the other jet (jet 2, the jet that first bent towards the east), which is partly hidden in projection due to the twisting motion. The consistent spectral indices α ∼ 1.4 of regions B and C might indicate that they have a common evolutionary history, but it is not trivial to account for the discrepant morphology that is observed at higher resolution.
Region D exhibits an ultra-steep spectrum of α ∼ 2.5 and appears to be connected to region C via a filament. A cluster member (G3) lies close the intersection of the two regions, but there is no evidence for an association with the radio emission.
All regions discussed above are embedded in diffuse emission with a steep spectral index α ∼ 1.3. This diffuse emission extends on scales of at least ∼200 kpc, and it is interestingly more concentrated towards the northern regions of the target. Considering the merging environment and the spectral and morphological radio properties, we suggest that the diffuse emission might be produced by particle re-acceleration from ICM turbulence, similarly to the formation of RHs (in particular, we note morphological similarities with the candidate mini RH in A3582S reported by Di Gennaro et al. 2025). Moreover, the diffuse emission may consist of aged electrons spread by the NAT during its motion and reprocessed by the cluster weather.
Regardless of the nature of the diffuse emission, re-acceleration processes are plausibly ongoing. The dynamics of the NAT and projection effects hamper any interpretation, however. Except for the NAT emission, we keep the classification by Botteon et al. (2022) of the other regions of the target in G172 as uncertain.
5. Discussion and conclusions
We reported the spectral study at 144 − 400 MHz of a sample of seven candidate revived fossil radio sources. They were selected by visual inspection of amorphous and filamentary sources detected among nearby and low-mass galaxy clusters in LoTSS-DR2 (Sect. 2, Fig. 1) and then followed-up with the uGMRT. The results reported in Sect. 4 demonstrated that our morphology-based selection is effective to identify steep-spectrum sources, as all of the targets exhibit regions having spectral indices α ≫ 1. We showed that sensitive high-resolution images are essential to avoid misclassification. Our analysis highlighted that no common dominant physical process underlies all sources we presented. It remains challenging to interpret their nature and reconstruct their history in many cases, however. In this section, we discuss our findings and future prospects. The (tentative) classification based on morphology, surface brightness profiles, spectral properties, optical associations, and measured quantities (distance from the cluster centre, size, flux densities, integrated spectral index, and radio power) is reported in Table 2.
The fossil radio source in G071 (Sect. 4.1) shows signs of re-acceleration along the filaments, and we classify it as a RP. Although the radio source in G113 (Sect. 4.3) shares properties with the RP in G071, we have no evidence of possible re-acceleration, and we thus consider it as a remnant. In G088 (Sect. 4.2) we identified a HT radio galaxy terminating with a GReET and two unrelated sources of unclear nature. The radio emission in G137 (Sect. 4.4) probably consists of two distinct sources, namely a WAT radio galaxy that ends with a long filament, and a radio source of uncertain nature, both of which showing evidence of re-acceleration. In G155 (Sect. 4.5) we identified a HT radio galaxy and an unrelated remnant component. In G165 (Sect. 4.6) we detected either a single or two distinct fossil components. In G172 (Sect. 4.7) we revealed a central NAT radio galaxy that is embedded in diffuse emission of unclear origin, which is likely the result of re-acceleration processes. The targets in G137, G155, and G172 are clear examples with complex regions that were revealed to be components of tailed galaxies, which might be easily misclassified or over-interpreted in the absence of sensitive high-resolution data. The confirmation of ongoing re-energising processes and definitive classification should be supported by a detailed study of the local conditions of the ICM with X-ray data. Specifically, the detection of discontinuities in the thermodynamic properties of the ICM co-spatial with the radio emission would be solid evidence of the thermal and non-thermal interplay. Furthermore, the various scenarios that we proposed should be investigated with additional radio observations; our campaign at 400 MHz provided vital flux density and spectral index measurements (Table 2) to plan follow-ups.
One of the original goals of our work was to provide a first look on the occurrence of revived sources in galaxy clusters and search for possible correlations similar to those found for RRs and RHs that link the radio emission with the host cluster properties (e.g. Cassano et al. 2010; Cuciti et al. 2023; Jones et al. 2023). In the light of our findings and of the necessity of deeper investigation for a genuine classification, no quantitative conclusions can be drawn. Qualitatively, our analysis agrees with results from the literature that showed that revived sources can inhabit low-mass systems with indications of large-scale disturbance (e.g. Mandal et al. 2020; Edler et al. 2022). Specifically, all our targets with available X-ray data are found in (mildly or highly) disturbed systems, as confirmed by the morphological parameter distribution shown in Fig. D.1 in Appendix D. Moreover, our images show that fossil electrons can be spread across a large fraction of the cluster volume, thus serving as reservoirs of seed cosmic rays in the ICM. This agrees with predictions from simulations (e.g. ZuHone et al. 2021; Vazza & Botteon 2024).
Revived fossils are also particularly interesting in the framework of physics of radio filaments, a topic that is becoming increasingly appealing with the advent of the current generation of interferometers (e.g. Ramatsoku et al. 2020; Condon et al. 2021; Yusef-Zadeh et al. 2022; Rudnick et al. 2022; Candini et al. 2023; Brienza et al. 2025; Churazov et al. 2025; De Rubeis et al. 2025; Giacintucci et al. 2025). Whether these filaments originate from radio galaxies or trace local conditions of the ICM magnetic fields is unclear. It is also not understood if all filaments are produced and powered by the same mechanisms. In this context, we found different behaviours for filaments in our radio sources. For G071, the surface brightness increases and decreases along different parts of filaments A and B, and the ultra-steep spectral index (α ∼ 2.3) of filament A is constant across ∼100 kpc (Fig. B.1). Along the filament in G137, the surface brightness oscillates around an approximately constant value across ∼130 kpc, but the spectral index gradually steepens (Fig. B.3). Intricate intersected filaments are found for G113 and G172 (Figs. 3, 8).
In conclusion, our work needs to be complemented by further multi-wavelength analysis to distinguish the mechanisms that cause the observed radio emission. Nevertheless, it represents a step towards developing observing strategies and methods for identifying and characterising the diversity of fossil and revived fossil sources in radio surveys, such as carrying out explorative campaigns to constrain the spatial spectral distribution serving for further follow-ups, and pushing for the resolution of the instruments. While our sample is limited to nearby low-mass clusters, Botteon et al. (2022) reported possible revived fossils in wider redshift and mass ranges, suggesting that these apparently rare sources may be more common than generally thought. In this context, the upcoming release of LoTSS-DR3 (Shimwell et al., in prep.) will enable the search for potential revived sources across the entire northern sky. Their search can be automatised through machine-learning based algorithms (e.g. Mostert et al. 2021; Gupta et al. 2022; Stuardi et al. 2024), as we have validated our visual-based selection method. Moreover, the (sub)-arcsecond resolution provided by the international stations of LOFAR will offer new insights into the intricate structures of these sources. Finally, the Square Kilometre Array and its precursors will still play a key role through their combination of resolution and sensitivity. We anticipate significant progress in the near future in the study of these elusive and complex targets, which have largely been overlooked so far.
Data availability
A copy of the reduced images is available at the CDS via https://cdsarc.cds.unistra.fr/viz-bin/cat/J/A+A/704/A245
Acknowledgments
We thank the referee for their constructive comments on the manuscript. MarBrü acknowledges support from the Deutsche Forschungsgemeinschaft under Germany’s Excellence Strategy - EXC 2121 “Quantum Universe” – 390833306. EDR is supported by the Fondazione ICSC, Spoke 3 Astrophysics and Cosmos Observations. National Recovery and Resilience Plan (Piano Nazionale di Ripresa e Resilienza, PNRR) Project ID CN_00000013 “Italian Research Center for High-Performance Computing, Big Data and Quantum Computing” funded by MUR Missione 4 Componente 2 Investimento 1.4: Potenziamento strutture di ricerca e creazione di “campioni nazionali di R&S (M4C2-19)” – Next Generation EU (NGEU). FdG acknowledges support from the ERC Consolidator Grant ULU 101086378. AI acknowledges funding from the European Research Council (ERC) under the European Union’s Horizon 2020 research and innovation programme (grant agreement No. 833824). LOFAR (van Haarlem et al. 2013) is the Low Frequency Array designed and constructed by ASTRON. It has observing, data processing, and data storage facilities in several countries, which are owned by various parties (each with their own funding sources), and that are collectively operated by the ILT foundation under a joint scientific policy. The ILT resources have benefited from the following recent major funding sources: CNRS-INSU, Observatoire de Paris and Université d’Orléans, France; BMBF, MIWF- NRW, MPG, Germany; Science Foundation Ireland (SFI), Department of Business, Enterprise and Innovation (DBEI), Ireland; NWO, The Netherlands; The Science and Technology Facilities Council, UK; Ministry of Science and Higher Education, Poland; The Istituto Nazionale di Astrofisica (INAF), Italy. This research made use of the Dutch national e-infrastructure with support of the SURF Cooperative (e-infra 180169) and the LOFAR e-infra group. The Jülich LOFAR Long Term Archive and the German LOFAR network are both coordinated and operated by the Jülich Supercomputing Centre (JSC), and computing resources on the supercomputer JUWELS at JSC were provided by the Gauss Centre for Supercomputing e.V. (grant CHTB00) through the John von Neumann Institute for Computing (NIC). This research made use of the University of Hertfordshire high-performance computing facility and the LOFAR-UK computing facility located at the University of Hertfordshire and supported by STFC [ST/P000096/1], and of the Italian LOFAR-IT computing infrastructure supported and operated by INAF, including the resources within the PLEIADI special ‘LOFAR’ project by USC-C of INAF, and by the Physics Department of Turin University (under the agreement with Consorzio Interuniversitario per la Fisica Spaziale) at the C3S Supercomputing Centre, Italy. We thank the staff of the GMRT that made these observations possible. GMRT is run by the National Centre for Radio Astrophysics of the Tata Institute of Fundamental Research. The National Radio Astronomy Observatory is a facility of the National Science Foundation operated under cooperative agreement by Associated Universities, Inc. The Pan-STARRS1 Surveys (PS1) and the PS1 public science archive have been made possible through contributions by the Institute for Astronomy, the University of Hawaii, the Pan-STARRS Project Office, the Max-Planck Society and its participating institutes, the Max Planck Institute for Astronomy, Heidelberg and the Max Planck Institute for Extraterrestrial Physics, Garching, The Johns Hopkins University, Durham University, the University of Edinburgh, the Queen’s University Belfast, the Harvard-Smithsonian Center for Astrophysics, the Las Cumbres Observatory Global Telescope Network Incorporated, the National Central University of Taiwan, the Space Telescope Science Institute, the National Aeronautics and Space Administration under Grant No. NNX08AR22G issued through the Planetary Science Division of the NASA Science Mission Directorate, the National Science Foundation Grant No. AST–1238877, the University of Maryland, Eotvos Lorand University (ELTE), the Los Alamos National Laboratory, and the Gordon and Betty Moore Foundation. This work is based on observations obtained with XMM-Newton, an ESA science mission with instruments and contributions directly funded by ESA Member States and NASA. This research has made use of data obtained from the Chandra Data Archive and software provided by the Chandra X-ray Center (CXC) in the application package CIAO. This research has made use of SAOImageDS9, developed by Smithsonian Astrophysical Observatory (Joye et al. 2003). This research has made use of the VizieR catalogue access tool, CDS, Strasbourg Astronomical Observatory, France (DOI: 10.26093/cds/vizier). This research made use of APLpy, an open-source plotting package for Python (Robitaille & Bressert 2012), Astropy, a community-developed core Python package for Astronomy (Astropy Collaboration 2013, 2018), Matplotlib (Hunter 2007), Numpy (Harris et al. 2020), SciPy (Virtanen et al. 2020).
References
- Alam, S., Albareti, F. D., Allende Prieto, C., et al. 2015, ApJS, 219, 12 [Google Scholar]
- Astropy Collaboration (Robitaille, T. P., et al.) 2013, A&A, 558, A33 [NASA ADS] [CrossRef] [EDP Sciences] [Google Scholar]
- Astropy Collaboration (Price-Whelan, A. M., et al.) 2018, AJ, 156, 123 [Google Scholar]
- Botteon, A., Shimwell, T. W., Cassano, R., et al. 2022, A&A, 660, A78 [NASA ADS] [CrossRef] [EDP Sciences] [Google Scholar]
- Botteon, A., Balboni, M., Bartalucci, I., Gastaldello, F., & van Weeren, R. J. 2025, A&A, 698, A55 [NASA ADS] [CrossRef] [EDP Sciences] [Google Scholar]
- Brienza, M., Lovisari, L., Rajpurohit, K., et al. 2022, A&A, 661, A92 [NASA ADS] [CrossRef] [EDP Sciences] [Google Scholar]
- Brienza, M., Rajpurohit, K., Churazov, E., et al. 2025, A&A, 696, A239 [NASA ADS] [CrossRef] [EDP Sciences] [Google Scholar]
- Brunetti, G., & Jones, T. W. 2014, Int. J. Mod. Phys. D, 23, 1430007 [Google Scholar]
- Bruno, L., Brunetti, G., Botteon, A., et al. 2023, A&A, 672, A41 [NASA ADS] [CrossRef] [EDP Sciences] [Google Scholar]
- Bruno, L., Venturi, T., Dallacasa, D., et al. 2024, A&A, 690, A329 [NASA ADS] [CrossRef] [EDP Sciences] [Google Scholar]
- Candini, S., Brienza, M., Bonafede, A., et al. 2023, A&A, 677, A4 [NASA ADS] [CrossRef] [EDP Sciences] [Google Scholar]
- Cassano, R., Ettori, S., Giacintucci, S., et al. 2010, ApJ, 721, L82 [Google Scholar]
- Cassano, R., Cuciti, V., Brunetti, G., et al. 2023, A&A, 672, A43 [NASA ADS] [CrossRef] [EDP Sciences] [Google Scholar]
- Churazov, E., Rudnick, L., Khabibullin, I., et al. 2025, A&A, submitted https://doi.org/10.1051/0004-6361/202556619 [Google Scholar]
- Clarke, T. E., Randall, S. W., Sarazin, C. L., Blanton, E. L., & Giacintucci, S. 2013, ApJ, 772, 84 [NASA ADS] [CrossRef] [Google Scholar]
- Cohen, A. S., & Clarke, T. E. 2011, AJ, 141, 149 [NASA ADS] [CrossRef] [Google Scholar]
- Condon, J. J., Cotton, W. D., White, S. V., et al. 2021, ApJ, 917, 18 [CrossRef] [Google Scholar]
- Cotton, W. D., Giri, G., Agnihotri, P. J., et al. 2025, ApJ, 989, 223 [Google Scholar]
- Cuciti, V., Cassano, R., Sereno, M., et al. 2023, A&A, 680, A30 [NASA ADS] [CrossRef] [EDP Sciences] [Google Scholar]
- Dálya, G., Galgóczi, G., Dobos, L., et al. 2018, MNRAS, 479, 2374 [Google Scholar]
- de Gasperin, F., Intema, H. T., Shimwell, T. W., et al. 2017, Sci. Adv., 3, e1701634 [Google Scholar]
- De Rubeis, E., Bondi, M., Botteon, A., et al. 2025, A&A, 699, A229 [NASA ADS] [CrossRef] [EDP Sciences] [Google Scholar]
- Di Gennaro, G., Venturi, T., Giacintucci, S., et al. 2025, A&A, 694, A28 [NASA ADS] [CrossRef] [EDP Sciences] [Google Scholar]
- Duncan, K. J. 2022, MNRAS, 512, 3662 [NASA ADS] [CrossRef] [Google Scholar]
- Edler, H. W., de Gasperin, F., Brunetti, G., et al. 2022, A&A, 666, A3 [NASA ADS] [CrossRef] [EDP Sciences] [Google Scholar]
- Enßlin, T. A., & Brüggen, M. 2002, MNRAS, 331, 1011 [Google Scholar]
- Enßlin, T. A., & Gopal-Krishna 2001, A&A, 366, 26 [NASA ADS] [CrossRef] [EDP Sciences] [Google Scholar]
- Fanaroff, B. L., & Riley, J. M. 1974, MNRAS, 167, 31P [Google Scholar]
- Flewelling, H. A., Magnier, E. A., Chambers, K. C., et al. 2020, ApJS, 251, 7 [NASA ADS] [CrossRef] [Google Scholar]
- Giacintucci, S., Markevitch, M., Clarke, T., & Wik, D. R. 2025, ApJ, 990, 71 [Google Scholar]
- Gitti, M. 2013, MNRAS, 436, L84 [NASA ADS] [CrossRef] [Google Scholar]
- Gitti, M., Brunetti, G., Feretti, L., & Setti, G. 2004, A&A, 417, 1 [NASA ADS] [CrossRef] [EDP Sciences] [Google Scholar]
- Gopal-Krishna, & Wiita, P. J. 2024, J. Astrophys. Astron., 45, 12 [Google Scholar]
- Gupta, N., Huynh, M., Norris, R. P., et al. 2022, PASA, 39, e051 [Google Scholar]
- Harris, C. R., Millman, K. J., van der Walt, S. J., et al. 2020, Nature, 585, 357 [NASA ADS] [CrossRef] [Google Scholar]
- Hunter, J. D. 2007, Comput. Sci. Eng., 9, 90 [NASA ADS] [CrossRef] [Google Scholar]
- Ignesti, A., Brunetti, G., Shimwell, T., et al. 2022, A&A, 659, A20 [NASA ADS] [CrossRef] [EDP Sciences] [Google Scholar]
- Ignesti, A., Gitti, M., Brunetti, G., Feretti, L., & Giovannini, G. 2017, A&A, 604, A21 [NASA ADS] [CrossRef] [EDP Sciences] [Google Scholar]
- Ignesti, A., Shimwell, T., Brunetti, G., et al. 2020, A&A, 643, A172 [NASA ADS] [CrossRef] [EDP Sciences] [Google Scholar]
- Intema, H. T., van der Tol, S., Cotton, W. D., et al. 2009, A&A, 501, 1185 [NASA ADS] [CrossRef] [EDP Sciences] [Google Scholar]
- Jones, A., de Gasperin, F., Cuciti, V., et al. 2023, A&A, 680, A31 [NASA ADS] [CrossRef] [EDP Sciences] [Google Scholar]
- Joye, W. A., & Mandel, E. 2003, in Astronomical Data Analysis Software and Systems XII, eds. H. E. Payne, R. I. Jedrzejewski, & R. N. Hook, ASP Conf. Ser., 295, 489 [NASA ADS] [Google Scholar]
- Kale, R., & Gitti, M. 2017, MNRAS, 466, L19 [NASA ADS] [CrossRef] [Google Scholar]
- Kale, R., Parekh, V., & Dwarakanath, K. S. 2018, MNRAS, 480, 5352 [NASA ADS] [CrossRef] [Google Scholar]
- Kempner, J. C., Blanton, E. L., & Clarke, T. E. 2004, in The Riddle of Cooling Flows in Galaxies and Clusters of Galaxies, eds. T. Reiprich, J. Kempner, & N. Soker, 335 [Google Scholar]
- Lacy, M., Baum, S. A., Chandler, C. J., et al. 2020, PASP, 132, 035001 [Google Scholar]
- Lal, D. V. 2020, AJ, 160, 161 [Google Scholar]
- Lal, D. V., Lyskova, N., Zhang, C., et al. 2022, ApJ, 934, 170 [NASA ADS] [CrossRef] [Google Scholar]
- Lusetti, G., de Gasperin, F., Cuciti, V., et al. 2024, MNRAS, 528, 141 [NASA ADS] [CrossRef] [Google Scholar]
- Mandal, S., Intema, H. T., van Weeren, R. J., et al. 2020, A&A, 634, A4 [NASA ADS] [CrossRef] [EDP Sciences] [Google Scholar]
- McMullin, J. P., Waters, B., Schiebel, D., Young, W., & Golap, K. 2007, in Astronomical Data Analysis Software and Systems XVI, eds. R. A. Shaw, F. Hill, & D. J. Bell, ASP Conf. Ser., 376, 127 [Google Scholar]
- Miley, G. K., Perola, G. C., van der Kruit, P. C., & van der Laan, H. 1972, Nature, 237, 269 [NASA ADS] [CrossRef] [Google Scholar]
- Mohr, J. J., Fabricant, D. G., & Geller, M. J. 1993, ApJ, 413, 492 [Google Scholar]
- Mostert, R. I. J., Duncan, K. J., Röttgering, H. J. A., et al. 2021, A&A, 645, A89 [NASA ADS] [CrossRef] [EDP Sciences] [Google Scholar]
- Nolting, C., Jones, T. W., O’Neill, B. J., & Mendygral, P. J. 2019, ApJ, 885, 80 [NASA ADS] [CrossRef] [Google Scholar]
- Offringa, A. R., & Smirnov, O. 2017, MNRAS, 471, 301 [Google Scholar]
- Offringa, A. R., McKinley, B., Hurley-Walker, N., et al. 2014, MNRAS, 444, 606 [Google Scholar]
- Owen, F. N., & Rudnick, L. 1976, ApJ, 205, L1 [NASA ADS] [CrossRef] [Google Scholar]
- Pasini, T., Edler, H. W., Brüggen, M., et al. 2022, A&A, 663, A105 [NASA ADS] [CrossRef] [EDP Sciences] [Google Scholar]
- Planck Collaboration XXIV. 2016, A&A, 594, A24 [NASA ADS] [CrossRef] [EDP Sciences] [Google Scholar]
- Poole, G. B., Fardal, M. A., Babul, A., et al. 2006, MNRAS, 373, 881 [Google Scholar]
- Rahaman, M., Raja, R., Datta, A., Burns, J. O., & Rapetti, D. 2022, MNRAS, 515, 2245 [CrossRef] [Google Scholar]
- Raja, R., Rahaman, M., Datta, A., & Smirnov, O. M. 2024, ApJ, 975, 125 [Google Scholar]
- Ramatsoku, M., Murgia, M., Vacca, V., et al. 2020, A&A, 636, L1 [NASA ADS] [CrossRef] [EDP Sciences] [Google Scholar]
- Rines, K. J., Geller, M. J., Diaferio, A., & Hwang, H. S. 2016, ApJ, 819, 63 [NASA ADS] [CrossRef] [Google Scholar]
- Robitaille, T., & Bressert, E. 2012, Astrophysics Source Code Library [record ascl:1208.017] [Google Scholar]
- Rotella, N., Ubertosi, F., Gitti, M., et al. 2025, A&A, 697, A232 [NASA ADS] [CrossRef] [EDP Sciences] [Google Scholar]
- Rudnick, L., Brüggen, M., Brunetti, G., et al. 2022, ApJ, 935, 168 [NASA ADS] [CrossRef] [Google Scholar]
- Santos, J. S., Rosati, P., Tozzi, P., et al. 2008, A&A, 483, 35 [NASA ADS] [CrossRef] [EDP Sciences] [Google Scholar]
- Shimwell, T. W., Luckin, J., Brüggen, M., et al. 2016, MNRAS, 459, 277 [Google Scholar]
- Shimwell, T. W., Hardcastle, M. J., Tasse, C., et al. 2022, A&A, 659, A1 [NASA ADS] [CrossRef] [EDP Sciences] [Google Scholar]
- Shulevski, A., Brienza, M., Massaro, F., et al. 2024, A&A, 682, A171 [NASA ADS] [CrossRef] [EDP Sciences] [Google Scholar]
- Slee, O. B., Roy, A. L., Murgia, M., Andernach, H., & Ehle, M. 2001, AJ, 122, 1172 [NASA ADS] [CrossRef] [Google Scholar]
- Stuardi, C., Gheller, C., Vazza, F., & Botteon, A. 2024, MNRAS, 533, 3194 [NASA ADS] [CrossRef] [Google Scholar]
- van Haarlem, M. P., Wise, M. W., Gunst, A. W., et al. 2013, A&A, 556, A2 [NASA ADS] [CrossRef] [EDP Sciences] [Google Scholar]
- van Weeren, R. J., de Gasperin, F., Akamatsu, H., et al. 2019, SSR, 215, 16 [Google Scholar]
- van Weeren, R. J., Shimwell, T. W., Botteon, A., et al. 2021, A&A, 651, A115 [NASA ADS] [CrossRef] [EDP Sciences] [Google Scholar]
- Vazza, F., & Botteon, A. 2024, Galaxies, 12, 19 [NASA ADS] [CrossRef] [Google Scholar]
- Virtanen, P., Gommers, R., Oliphant, T. E., et al. 2020, Nat. Methods, 17, 261 [Google Scholar]
- Wen, Z. L., & Han, J. L. 2015, ApJ, 807, 178 [Google Scholar]
- Whyley, A., Randall, S. W., Clarke, T. E., et al. 2025, MNRAS, 538, 3326 [Google Scholar]
- Yusef-Zadeh, F., Arendt, R. G., & Wardle, M. 2022, ApJ, 939, L21 [NASA ADS] [CrossRef] [Google Scholar]
- Zhang, X., Simionescu, A., Gastaldello, F., et al. 2023, A&A, 672, A42 [NASA ADS] [CrossRef] [EDP Sciences] [Google Scholar]
- ZuHone, J. A., Markevitch, M., Weinberger, R., Nulsen, P., & Ehlert, K. 2021, ApJ, 914, 73 [NASA ADS] [CrossRef] [Google Scholar]
Data products are publicly available on the project website: https://lofar-surveys.org/planck_dr2.html
Appendix A: Spectral index error maps
In Fig. A.1, we report the error maps associated with the spectral index maps shown in Figs. 2-8.
Appendix B: Surface brightness and spectral index profiles
In Figs. B.1-B.4 we report surface brightness and spectral index profiles of the targets in G071, G088, G137, and G155. These profiles are discussed in Sect. 4 to interpret the nature of the targets.
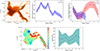 |
Fig. B.1. Profiles of the target in G071. Top left: 144 MHz image at resolution θ = 8″×8″ sampled with beam-size circles (8″ = 22 kpc at z = 0.157). Top centre: surface brightness profile along filament A. Top right: surface brightness profile along filaments B and C. In top centre and right panels, the horizontal dotted line indicates the 3σ level of the image. Bottom left: spectral index map sampled with beam-size (θ = 8″×8″) circles. Bottom right: Spectral index profile along filament A. |
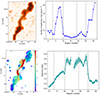 |
Fig. B.2. Profiles of the target in G088. Top left: 144 MHz image at resolution θ = 10″×10″ sampled with beam-size circles (10″ = 24 kpc at z = 0.133). Top right: surface brightness profile. The horizontal dotted line indicates the 3σ level of the image. Bottom left: spectral index map sampled with beam-size (θ = 10″×10″) circles. Bottom right: Spectral index profile. In both right panels, the transition between the source regions (A to E) are indicated by vertical dashed lines. |
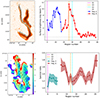 |
Fig. B.3. Profiles of the target in G137. Top left: 144 MHz image at resolution θ = 4″×3″ sampled with beam-size circles (4″ = 7 kpc at z = 0.087). Top right: surface brightness profiles for source regions A and B. The horizontal dotted line indicates the 3σ level of the image. Bottom left: spectral index map sampled with beam-size (θ = 10″×10″) circles. Bottom right: Spectral index profile for source regions A and B. In both right panels, the position of the galaxies G1, G2, and G3 is indicated by vertical dashed lines. |
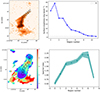 |
Fig. B.4. Profiles of the target in G155. Top left: 144 MHz image at resolution θ = 4″×3″ sampled with beam-size circles (4″ = 19 kpc at z = 0.333). Top right: surface brightness profile. The horizontal dotted line indicates the 3σ level of the image. Bottom left: spectral index map (θ = 8″×8″) sampled with beam-size circles. Bottom right: Spectral index profile. |
Appendix C: Possible hosts galaxies
In Table C.1 we report redshift from the literature for galaxies identified as possible hosts of the radio sources (see Sect. 4). These have been identified by visual inspection of Pan-STARRS images, in regions close to the targets. In a few cases, the value of z indicates that the galaxy is not a cluster member.
Properties of the galaxies discussed in Sect. 4.
Appendix D: X-ray data and morphological parameters
Zhang et al. (2023) analysed X-ray data of PSZ2 clusters in LoTSS-DR2 with available Chandra and/or XMM-Newton, produced the images shown in Figs. 2, 4, 5, and 8, and derived the centroid shift (w; Mohr et al. 1993; Poole et al. 2006) and concentration (c; Santos et al. 2008) morphological parameters. Such observations are not available for G088, G155, and G165 in our sample.
For G088, we retrieved pointed (11 ks long, ObsID: 800413, PI: A. Fabian) observations in the 0.1-2.4 keV band from the ROentgen SATellite carried out with the Position Sensitive Proportional Counter detector (ROSAT PSPC). The ROSAT PSPC exposure-corrected image (smoothed with a Gaussian function having FWHM ∼ 100 kpc) is shown in Fig. 3. Following similar procedures as those detailed in Botteon et al. (2022) and Zhang et al. (2023), we measured c and w for G088 (Table 1).
For G165, we retrieved and analysed Chandra observations (10 ks long, ObsID: 7752, PI: C. Vignali). The 0.5-2 keV exposure-corrected image (smoothed with a Gaussian function having FWHM ∼ 100 kpc) is shown in Fig. 7. The sensitivity is insufficient to firmly claim the detection of the ICM, and thus determine the dynamical state of the cluster.
In Fig. D.1 we report the c and w distribution for clusters in our sample, considering in addition G080.41−33.24 and G100.45−38.42 (see details in Sect. 2). The dashed lines (c = 0.2, w = 0.012; Cassano et al. 2010) are references to distinguish between relaxed (high c, low w) and disturbed (low c, high w) systems. This plot shows that candidate revived fossils in our sample tend to inhabit disturbed systems. However, the low statistic does not allow us to provide firm conclusions. Moreover, we notice that G100.45-38.42, which is the host of the ‘Kite’ revived source, is a relaxed system.
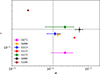 |
Fig. D.1. Distribution of clusters with available X-ray data in the c − w diagram. The dashed lines are the reference values c = 0.2 and w = 0.012 as in Cassano et al. 2010. The clusters G080.41-33.24 and G100.45-38.42 are also reported (see details in Sect. 2). |
Appendix E: VLASS images
In Figs. E.1 and E.2 we report VLASS images discussed in Sect. 4.4 and Sect. 4.7.
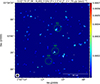 |
Fig. E.1. VLASS radio image of G137.74-27.08 at 3 GHz (units are Jy beam−1). Resolution and noise are reported on top of the panel. The contour levels are [ ± 3, 6, 12, 24, ...] × σ. Green circles indicate optical sources discussed in Sect. 4.4. |
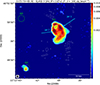 |
Fig. E.2. VLASS radio image of G172.74+65.30 at 3 GHz (units are Jy beam−1). Resolution and noise are reported on top of the panel. The contour levels are [ ± 3, 6, 12, 24, ...] × σ. Green circles and cyan arrows indicate optical sources and regions discussed in Sect. 4.7. The blue and purple dashed lines roughly indicate the putative twisting path of jets 1 and 2, respectively. |
All Tables
All Figures
|
Fig. 1. Overview of the candidate revived fossil sources identified by visual inspection among low-z and low-M500 PSZ2 clusters in LoTSS-DR2 based on their irregular and filamentary morphology. |
| In the text | |
|
Fig. 2. Images of G071.63+29.78. Top: LOFAR at 144 MHz and uGMRT at 400 MHz radio images (units are Jy beam−1). The resolution and noise are reported at the top of each panel. The contour levels are [ ± 3, 6, 12, …] × σ. Bottom left: Pan-STARRS optical (composite i, r, g filter) image. The orange contours are from the radio images in the top panels. The green circles and cyan lines indicate optical sources and regions discussed in the text. Bottom centre: 144–400 MHz spectral index map (the error map is shown in Fig. A.1). The contour levels are [ ± 3, 6, 12, …] × σ from the 144 MHz image. Bottom right: X-ray image of the cluster. The green contours are from the LOFAR image. The red and black crosses indicate the Planck centre and X-ray peak, respectively. |
| In the text | |
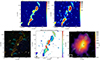 |
Fig. 3. Images of G088.53+41.18. The description of each panel is the same as for Fig. 2. |
| In the text | |
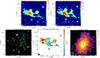 |
Fig. 4. Images of G113.29−29.69. The description of each panel is the same as for Fig. 2. |
| In the text | |
 |
Fig. 5. Images of G137.74−27.08. The description of each panel is the same as for Fig. 2. |
| In the text | |
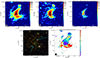 |
Fig. 6. Images of G155.80+70.40. The description of each panel is the same as for Fig. 2. |
| In the text | |
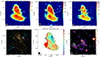 |
Fig. 7. Images of G165.68+44.01. The description of each panel is the same as for Fig. 2. |
| In the text | |
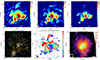 |
Fig. 8. Images of G172.74+65.30. The description of each panel is the same as for Fig. 2. |
| In the text | |
 |
Fig. A.1. Spectral index error maps corresponding to the maps shown in Figs. 2-8. |
| In the text | |
|
Fig. B.1. Profiles of the target in G071. Top left: 144 MHz image at resolution θ = 8″×8″ sampled with beam-size circles (8″ = 22 kpc at z = 0.157). Top centre: surface brightness profile along filament A. Top right: surface brightness profile along filaments B and C. In top centre and right panels, the horizontal dotted line indicates the 3σ level of the image. Bottom left: spectral index map sampled with beam-size (θ = 8″×8″) circles. Bottom right: Spectral index profile along filament A. |
| In the text | |
|
Fig. B.2. Profiles of the target in G088. Top left: 144 MHz image at resolution θ = 10″×10″ sampled with beam-size circles (10″ = 24 kpc at z = 0.133). Top right: surface brightness profile. The horizontal dotted line indicates the 3σ level of the image. Bottom left: spectral index map sampled with beam-size (θ = 10″×10″) circles. Bottom right: Spectral index profile. In both right panels, the transition between the source regions (A to E) are indicated by vertical dashed lines. |
| In the text | |
|
Fig. B.3. Profiles of the target in G137. Top left: 144 MHz image at resolution θ = 4″×3″ sampled with beam-size circles (4″ = 7 kpc at z = 0.087). Top right: surface brightness profiles for source regions A and B. The horizontal dotted line indicates the 3σ level of the image. Bottom left: spectral index map sampled with beam-size (θ = 10″×10″) circles. Bottom right: Spectral index profile for source regions A and B. In both right panels, the position of the galaxies G1, G2, and G3 is indicated by vertical dashed lines. |
| In the text | |
|
Fig. B.4. Profiles of the target in G155. Top left: 144 MHz image at resolution θ = 4″×3″ sampled with beam-size circles (4″ = 19 kpc at z = 0.333). Top right: surface brightness profile. The horizontal dotted line indicates the 3σ level of the image. Bottom left: spectral index map (θ = 8″×8″) sampled with beam-size circles. Bottom right: Spectral index profile. |
| In the text | |
|
Fig. D.1. Distribution of clusters with available X-ray data in the c − w diagram. The dashed lines are the reference values c = 0.2 and w = 0.012 as in Cassano et al. 2010. The clusters G080.41-33.24 and G100.45-38.42 are also reported (see details in Sect. 2). |
| In the text | |
|
Fig. E.1. VLASS radio image of G137.74-27.08 at 3 GHz (units are Jy beam−1). Resolution and noise are reported on top of the panel. The contour levels are [ ± 3, 6, 12, 24, ...] × σ. Green circles indicate optical sources discussed in Sect. 4.4. |
| In the text | |
|
Fig. E.2. VLASS radio image of G172.74+65.30 at 3 GHz (units are Jy beam−1). Resolution and noise are reported on top of the panel. The contour levels are [ ± 3, 6, 12, 24, ...] × σ. Green circles and cyan arrows indicate optical sources and regions discussed in Sect. 4.7. The blue and purple dashed lines roughly indicate the putative twisting path of jets 1 and 2, respectively. |
| In the text | |
Current usage metrics show cumulative count of Article Views (full-text article views including HTML views, PDF and ePub downloads, according to the available data) and Abstracts Views on Vision4Press platform.
Data correspond to usage on the plateform after 2015. The current usage metrics is available 48-96 hours after online publication and is updated daily on week days.
Initial download of the metrics may take a while.