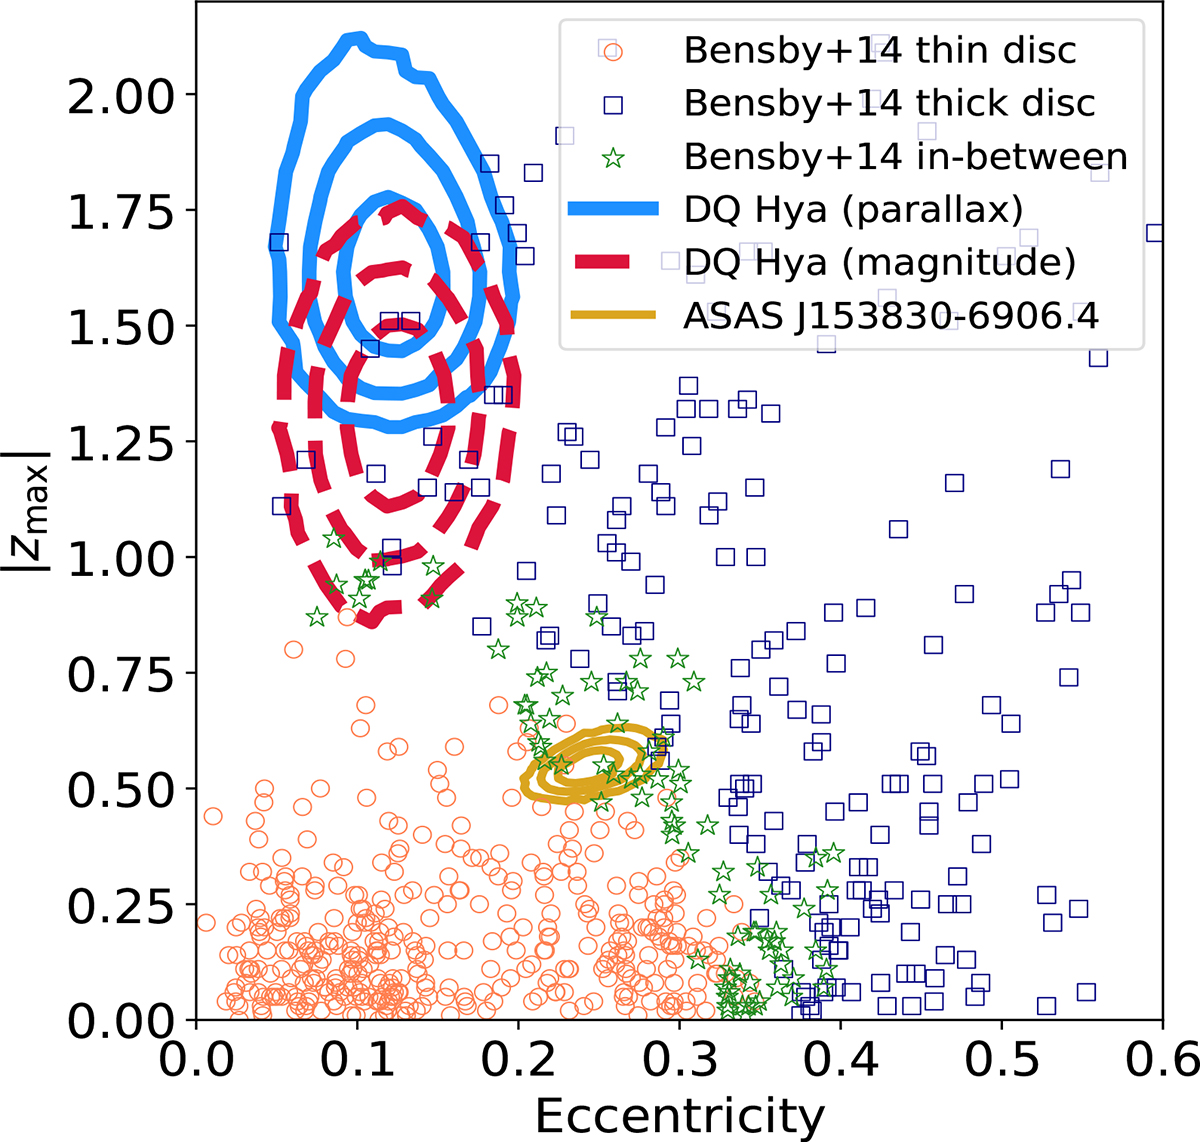
Fig. 5.
Download original image
Comparison of the orbital properties, eccentricity, and maximum distance from the Galactic plane, of DQ Hya and ASAS J153830−6906.4 with the sample of disc stars from Bensby et al. (2014, B14). The contours represent the 68%, 95%, and 99.7% confidence intervals from 105 orbit realisations; line styles and colours follow those used in Fig. 4. Circle and square markers indicate stars classified by B14 as likely thin disc and thick disc members, respectively, based on a thick-to-thin disc likelihood ratio of < 0.5 and > 2. Star-shaped markers represent stars in between the two components with intermediate likelihood ratios. Both our orbit integrations and those in B14 adopt the Galactic potential from Allen & Santillan (1991).
Current usage metrics show cumulative count of Article Views (full-text article views including HTML views, PDF and ePub downloads, according to the available data) and Abstracts Views on Vision4Press platform.
Data correspond to usage on the plateform after 2015. The current usage metrics is available 48-96 hours after online publication and is updated daily on week days.
Initial download of the metrics may take a while.