Fig. 7.
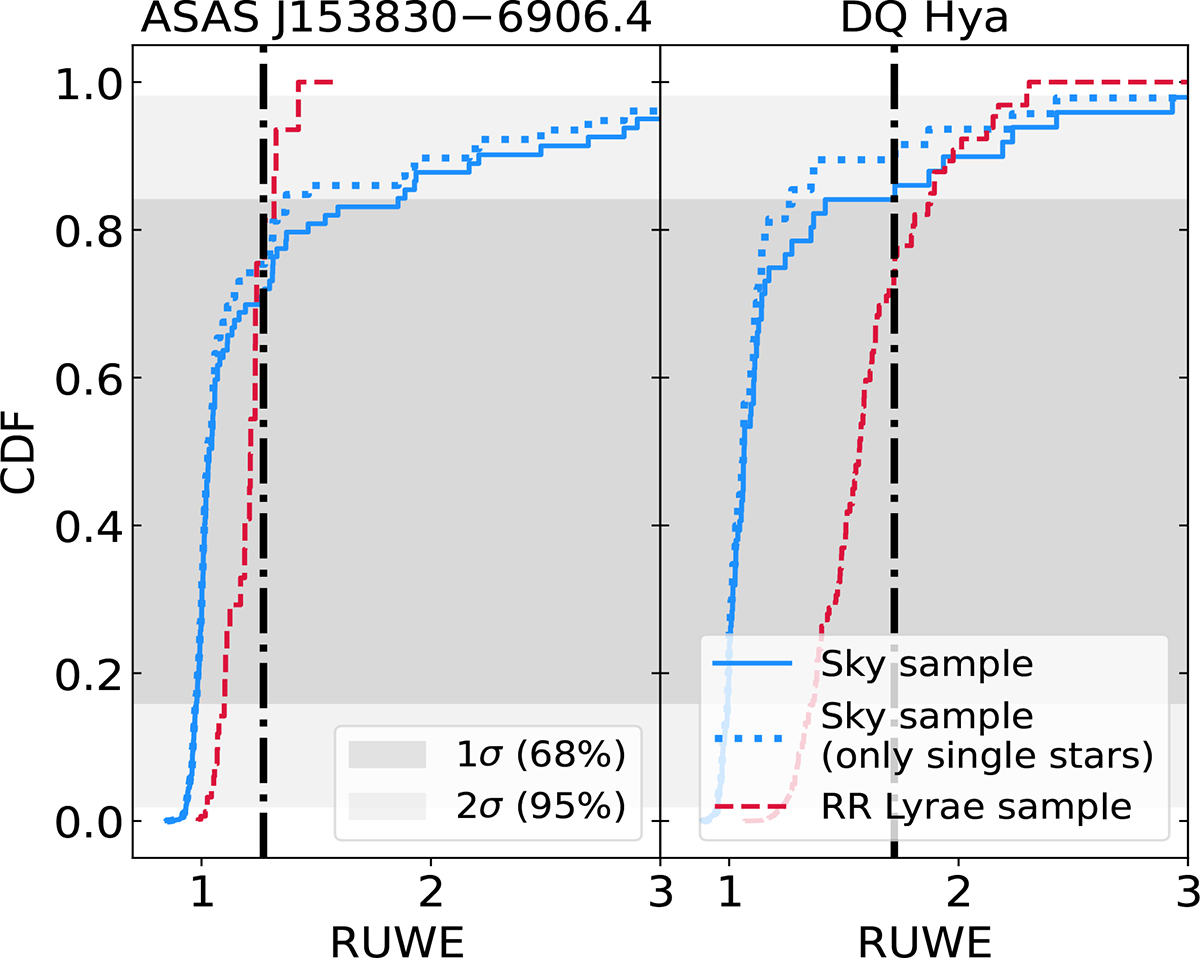
Download original image
RUWE values (vertical dash–dot black lines) of the two analysed RR Lyrae stars (left: ASAS J153830−6906.4, right: DQ Hya) compared to the cumulative distribution functions of the corresponding control samples. The solid blue line shows the CDF for the sky-position control sample, which includes stars in the same sky area with similar photometry. The dotted blue line shows the CDF for the same sample after removing stars classified as non-single in Gaia DR3. The dashed red line shows the CDF for the RR Lyrae control sample from Gaia DR3, selected to have similar photometry and light-curve properties to the targets (see text for details). The shaded regions indicate the central 68% (dark shading) and 95% (light shading) intervals of the distributions.
Current usage metrics show cumulative count of Article Views (full-text article views including HTML views, PDF and ePub downloads, according to the available data) and Abstracts Views on Vision4Press platform.
Data correspond to usage on the plateform after 2015. The current usage metrics is available 48-96 hours after online publication and is updated daily on week days.
Initial download of the metrics may take a while.