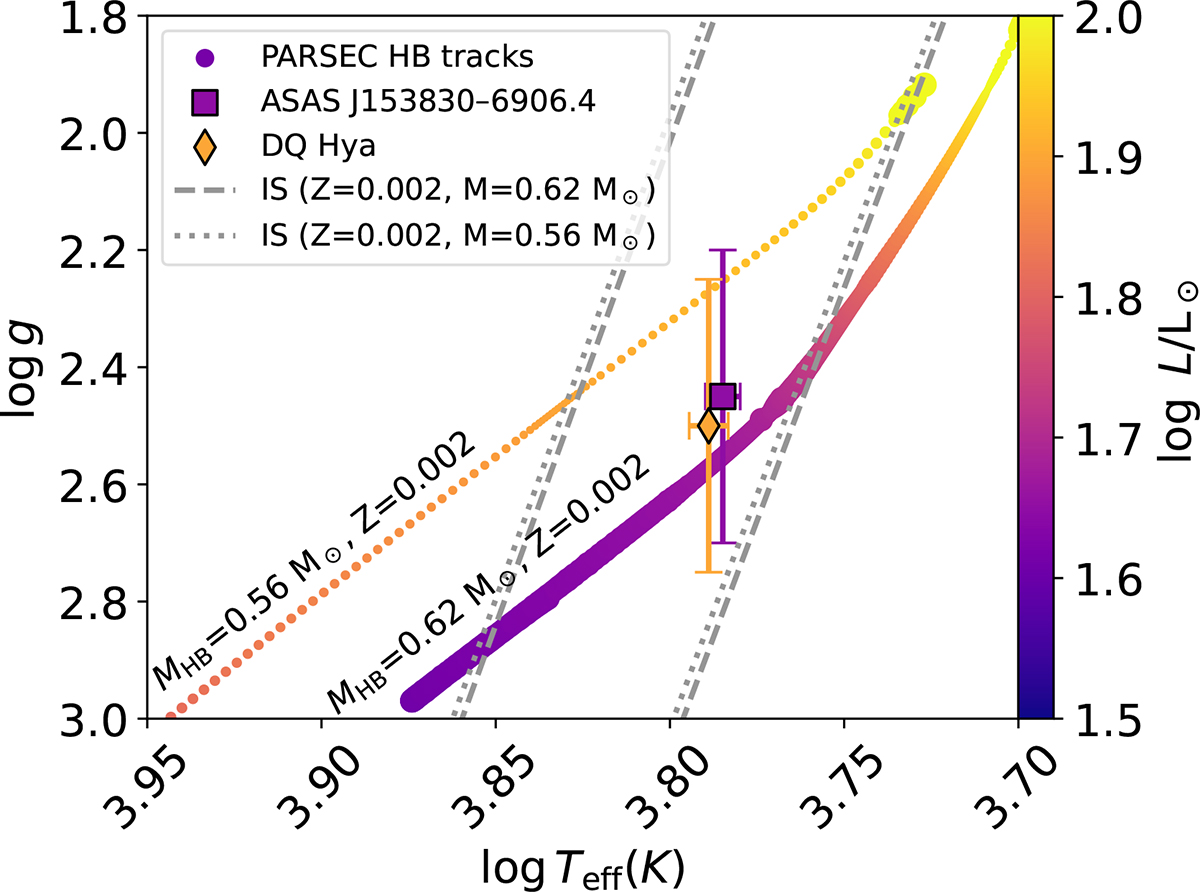
Fig. 8.
Download original image
Kiel diagram comparing the RR Lyrae stars analysed in this work (DQ Hya shown as a diamond, ASAS J153830−6906.4 as a square) with horizontal branch evolutionary tracks from the PARSEC V1.2S database (Chen et al. 2015, circles; masses and metallicities are indicated in the plot). The colour map represents the bolometric luminosity. For the observed stars, luminosities are derived using distances from parallaxes (see Sect. 4.1). The size of the circles along the tracks provides a qualitative indication of the time spent in each region of the diagram, with the largest symbols corresponding to approximately ten times longer evolutionary timescales than the smallest ones. The grey lines indicate the instability strip from Marconi et al. (2015), assuming a metallicity of Z = 0.002 and stellar masses of 0.56 M⊙ (dotted line) and 0.62 M⊙ (dashed line). The comparison is purely qualitative and does not represent the result of a fit.
Current usage metrics show cumulative count of Article Views (full-text article views including HTML views, PDF and ePub downloads, according to the available data) and Abstracts Views on Vision4Press platform.
Data correspond to usage on the plateform after 2015. The current usage metrics is available 48-96 hours after online publication and is updated daily on week days.
Initial download of the metrics may take a while.