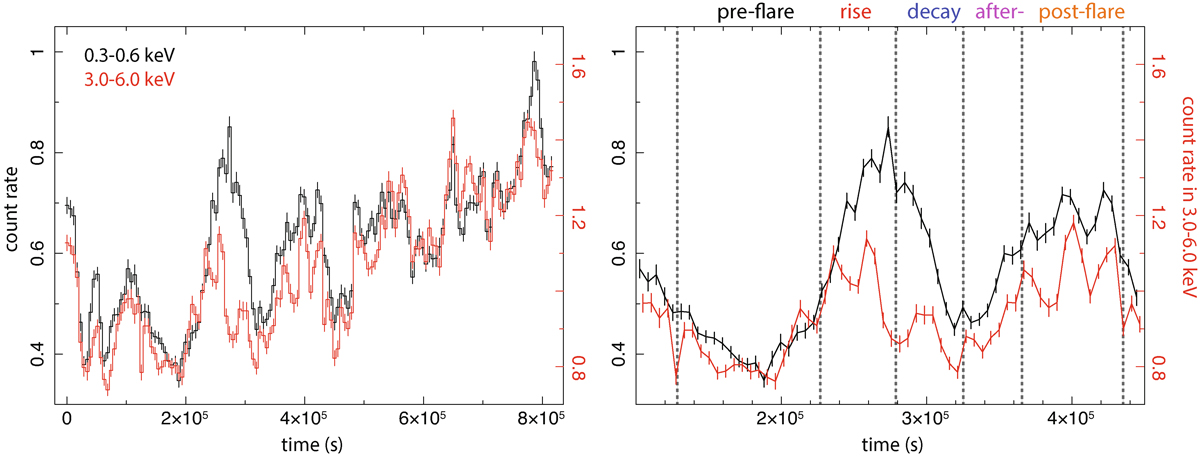
Fig. 1.
Download original image
XRISM Xtend light curves from the NGC 3783 campaign. Left: soft- and hard-band light curves, shown in black and red, respectively. The light curve has been binned to multiples of the XRISM orbit (5747 s), and in this paper we count time since the start of the XRISM observation. Right: X-ray variability surrounding the main soft flare at t ∼ 2.8 × 10⁵ s.
Current usage metrics show cumulative count of Article Views (full-text article views including HTML views, PDF and ePub downloads, according to the available data) and Abstracts Views on Vision4Press platform.
Data correspond to usage on the plateform after 2015. The current usage metrics is available 48-96 hours after online publication and is updated daily on week days.
Initial download of the metrics may take a while.