Fig. A.2.
Download original image
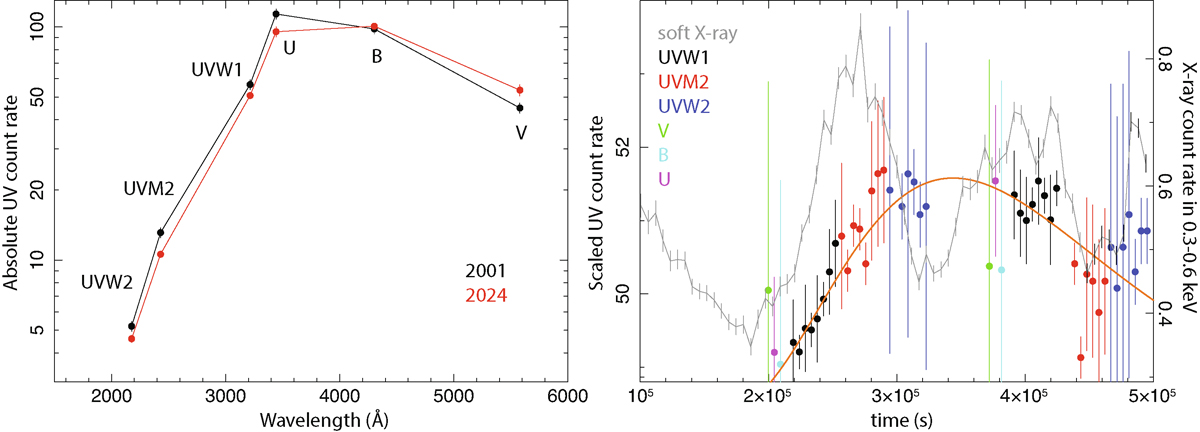
Left: Comparison of the time-averaged XMM-Newton OM spectrum from the current 2024 campaign with 2001 data. Right: Fluxes of different OM filters, scaled to the UVW1 filter, derived from the 2024 time-average spectrum. The best-fit phenomenological model is shown in red. The 0.3 − 0.6 keV X-ray light curve is overlaid for comparison.
Current usage metrics show cumulative count of Article Views (full-text article views including HTML views, PDF and ePub downloads, according to the available data) and Abstracts Views on Vision4Press platform.
Data correspond to usage on the plateform after 2015. The current usage metrics is available 48-96 hours after online publication and is updated daily on week days.
Initial download of the metrics may take a while.