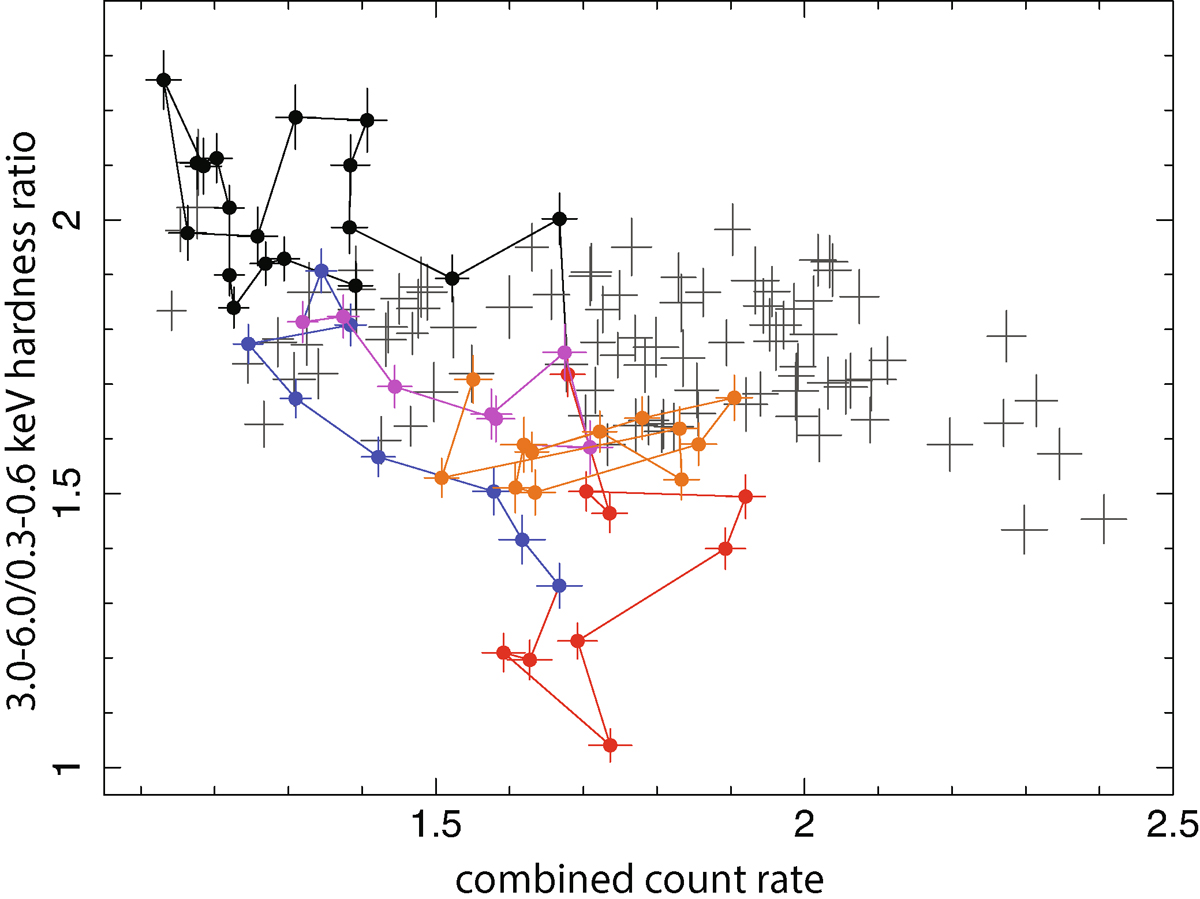
Fig. 2.
Download original image
Hardness ratio, defined by the count rates in the 3.0 − 6.0 keV and 0.3 − 0.6 keV bands, plotted against their combined count rate. Each data point represents a single XRISM orbit (5747 s). The data are color-coded by flare phase: pre-flare (black), rise (red), decay (blue), after-flare (magenta), and post-flare (orange). Gray points indicate observations outside the main soft flare.
Current usage metrics show cumulative count of Article Views (full-text article views including HTML views, PDF and ePub downloads, according to the available data) and Abstracts Views on Vision4Press platform.
Data correspond to usage on the plateform after 2015. The current usage metrics is available 48-96 hours after online publication and is updated daily on week days.
Initial download of the metrics may take a while.