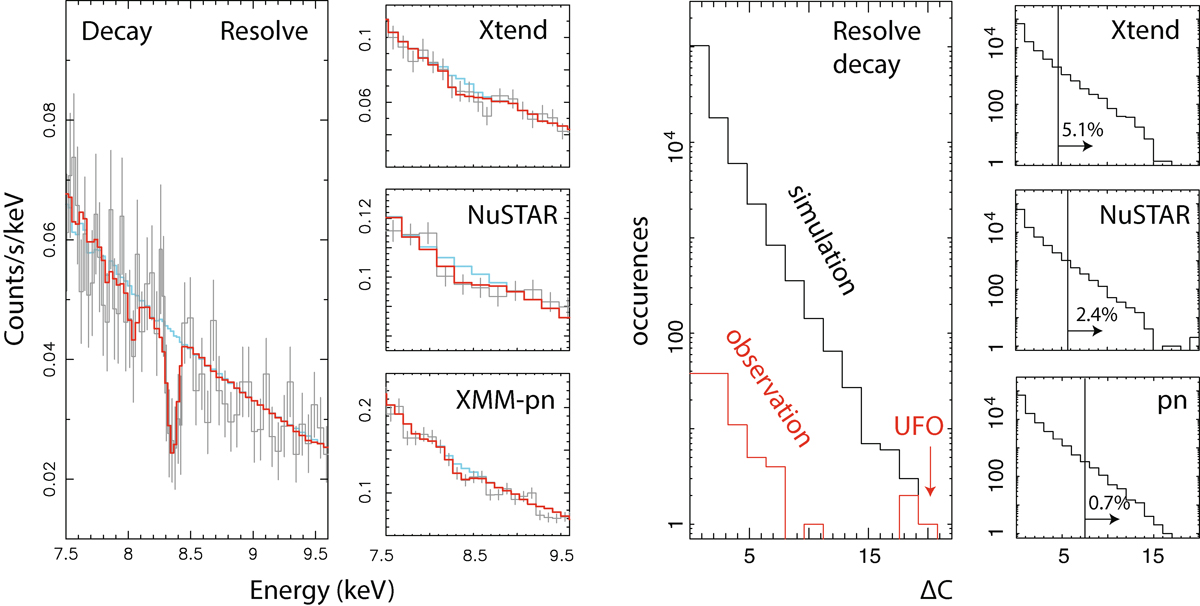
Fig. 4.
Download original image
Detailed look at the dip at 8.4 keV and the LEE. Left: Resolve, Xtend, NuSTAR, and XMM-Newton pn spectra from the decay phase. The red line shows the best-fit model to the Resolve data and including the UFO component, while the light blue line represents the model without it. Right: ΔC distribution from 1.3 × 10⁵ runs of the Monte Carlo simulation of the Resolve spectrum, and 1 × 10⁴ times for each of other three instruments (black histograms) and the observed ΔC distribution for the Resolve data (red histograms). Vertical lines mark the observed ΔC values for the other three instruments.
Current usage metrics show cumulative count of Article Views (full-text article views including HTML views, PDF and ePub downloads, according to the available data) and Abstracts Views on Vision4Press platform.
Data correspond to usage on the plateform after 2015. The current usage metrics is available 48-96 hours after online publication and is updated daily on week days.
Initial download of the metrics may take a while.