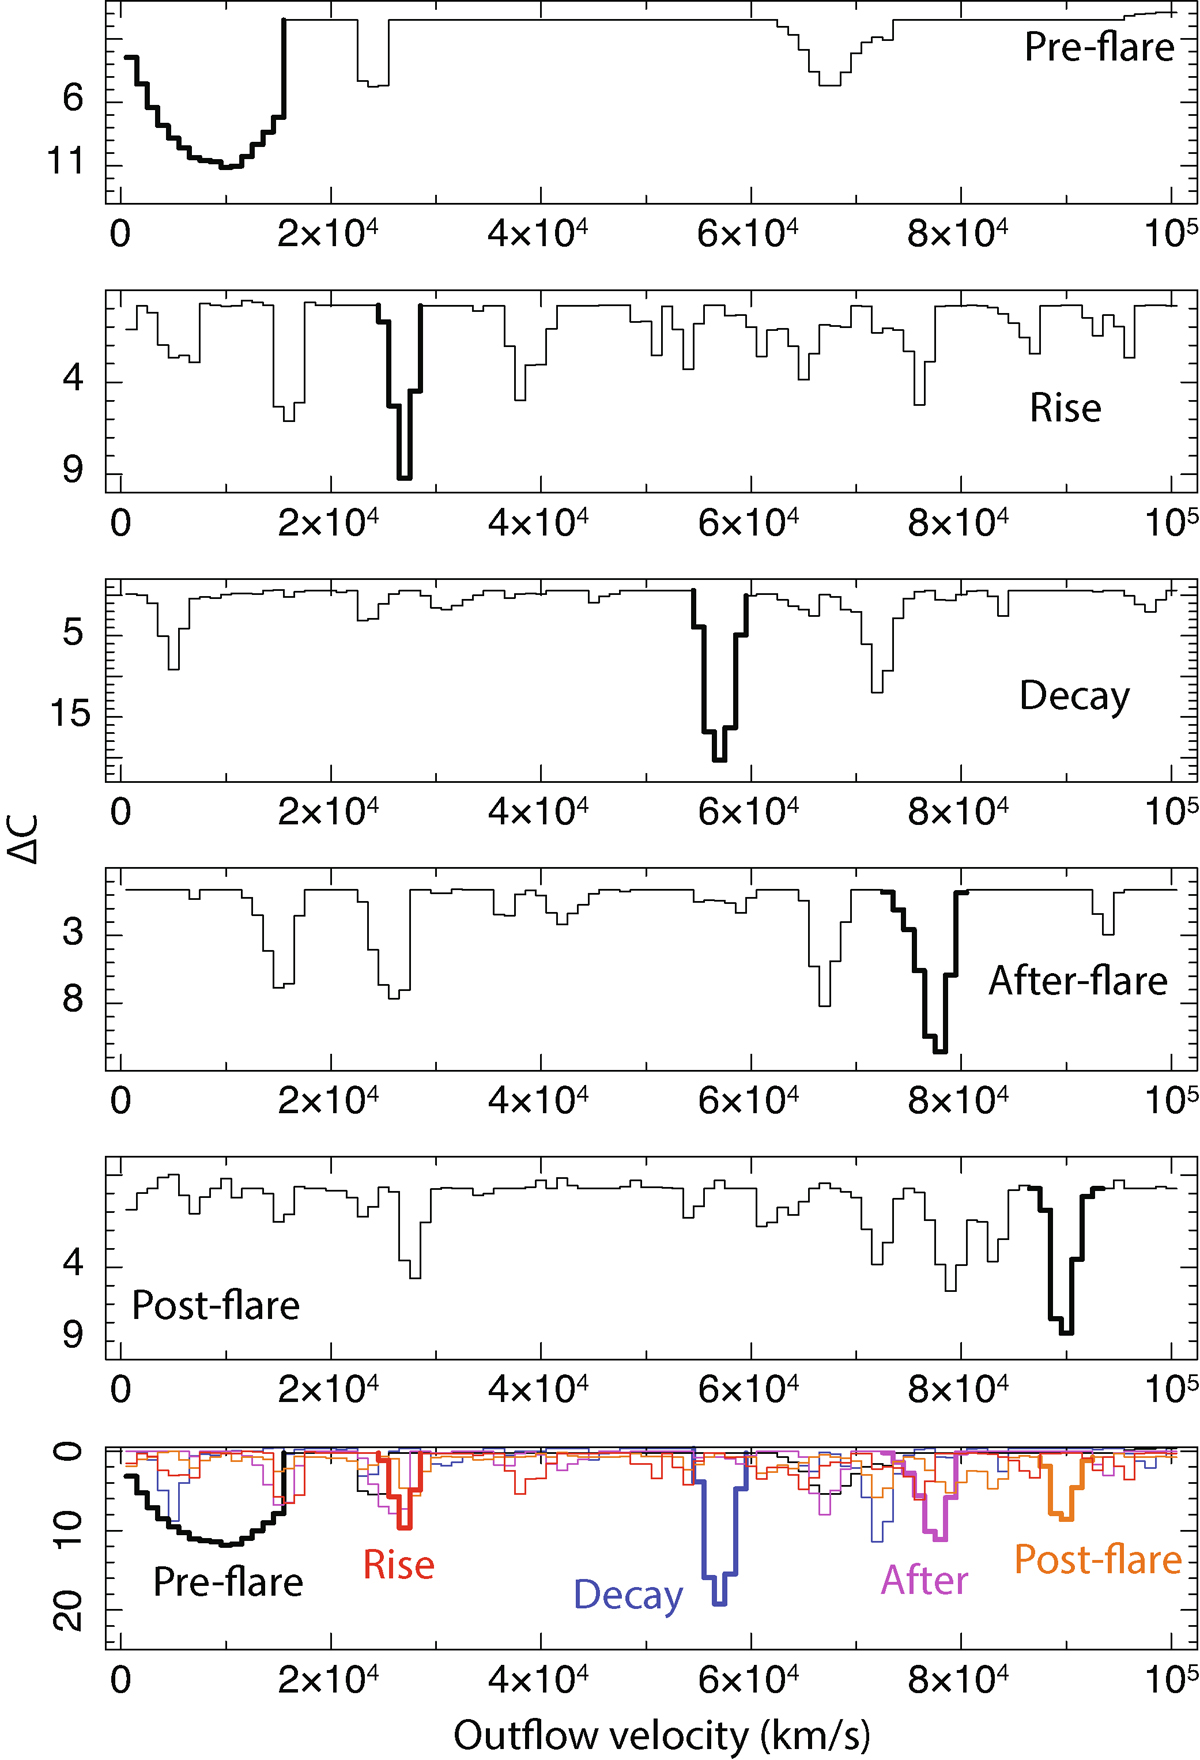
Fig. 6.
Download original image
Potential features identified with the pion scan on the Resolve data. The curves show the ΔC obtained in each step of the scan. The most prominent feature in each phase is highlighted with a thick line. In the bottom panel, all individual curves from the upper panels are combined and presented on a common ΔC scale for comparison.
Current usage metrics show cumulative count of Article Views (full-text article views including HTML views, PDF and ePub downloads, according to the available data) and Abstracts Views on Vision4Press platform.
Data correspond to usage on the plateform after 2015. The current usage metrics is available 48-96 hours after online publication and is updated daily on week days.
Initial download of the metrics may take a while.