Fig. 7.
Download original image
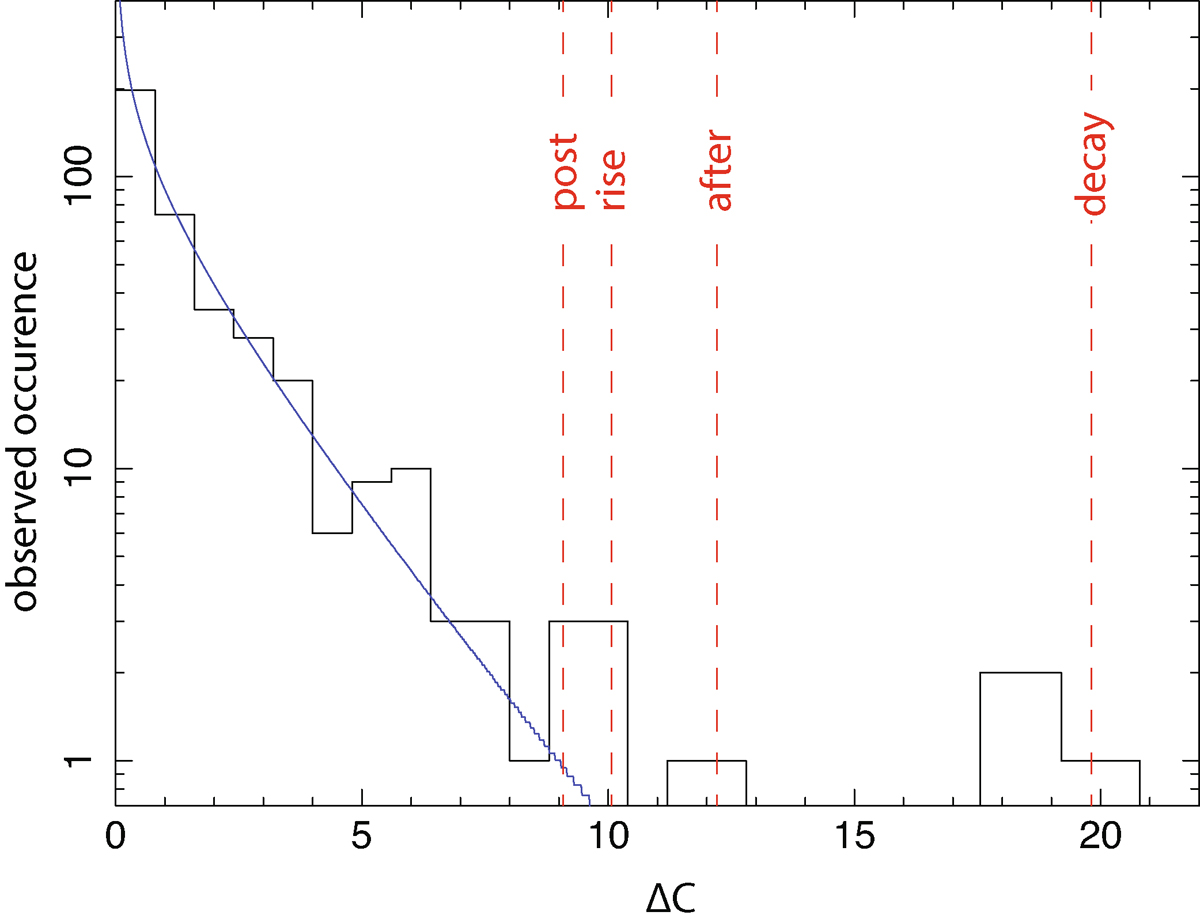
LEE in the pion scan. The black histogram shows the combined ΔC distribution from the rise, decay, after, and post-flare phases. The blue line represents an exponential fit to this histogram, following a form similar to that described in Sect. 2.3.2. The dashed red lines mark the ΔC values of the most prominent features identified in these phases.
Current usage metrics show cumulative count of Article Views (full-text article views including HTML views, PDF and ePub downloads, according to the available data) and Abstracts Views on Vision4Press platform.
Data correspond to usage on the plateform after 2015. The current usage metrics is available 48-96 hours after online publication and is updated daily on week days.
Initial download of the metrics may take a while.