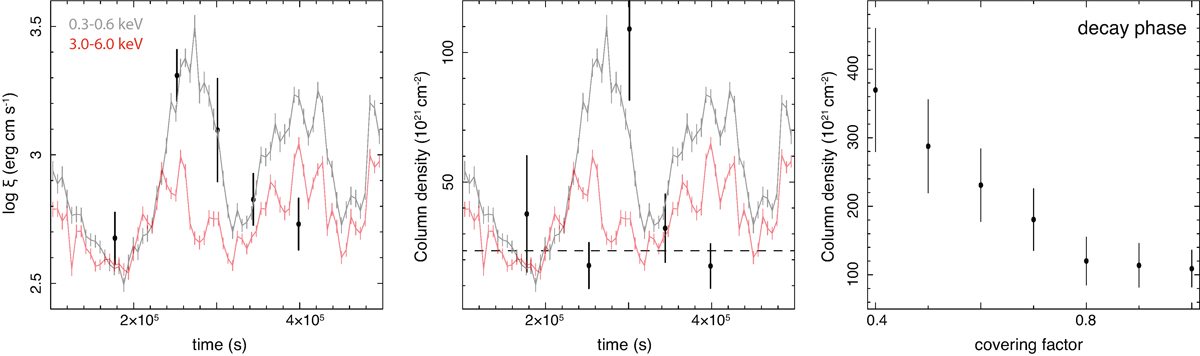
Fig. 8.
Download original image
Evolution of outflow parameters during the flare. Left: outflow parameter. Middle: column density. These two panels are overlaid with the soft-band (black) and hard-band (red) X-ray light curves. A horizontal dashed line in the middle panel indicates the average column density excluding the decay phase. Right: column density as a function of the covering factor for the decay phase.
Current usage metrics show cumulative count of Article Views (full-text article views including HTML views, PDF and ePub downloads, according to the available data) and Abstracts Views on Vision4Press platform.
Data correspond to usage on the plateform after 2015. The current usage metrics is available 48-96 hours after online publication and is updated daily on week days.
Initial download of the metrics may take a while.