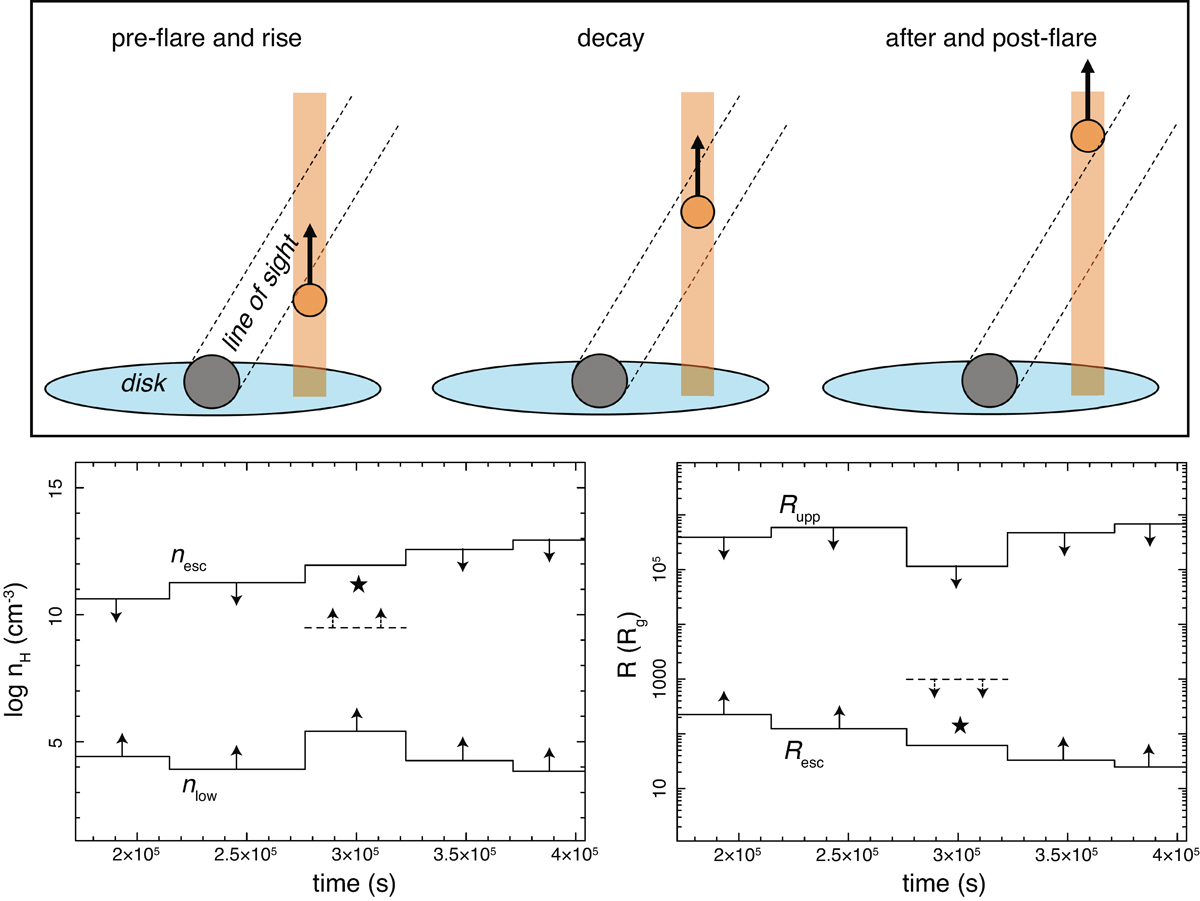
Fig. 9.
Download original image
Constraints on the density and distance of the outflow. Top: schematic illustrating a simple scenario: a clumpy outflow stream moving vertically from near the accretion disk, with the clump represented by the circle. Bottom: Density (left) and distance (right) constraints derived from the geometrical limits (nlow and Rupp) and escape velocity (nesc and Resc). Stars mark the density and distance values assuming that a clumpy component, observed during the decay phase, was launched at the pre-flare onset. The dashed line shows the density and distance limits estimated from the duration of the 8.4 keV dip during the decay phase.
Current usage metrics show cumulative count of Article Views (full-text article views including HTML views, PDF and ePub downloads, according to the available data) and Abstracts Views on Vision4Press platform.
Data correspond to usage on the plateform after 2015. The current usage metrics is available 48-96 hours after online publication and is updated daily on week days.
Initial download of the metrics may take a while.