Open Access
Fig. 1
Download original image
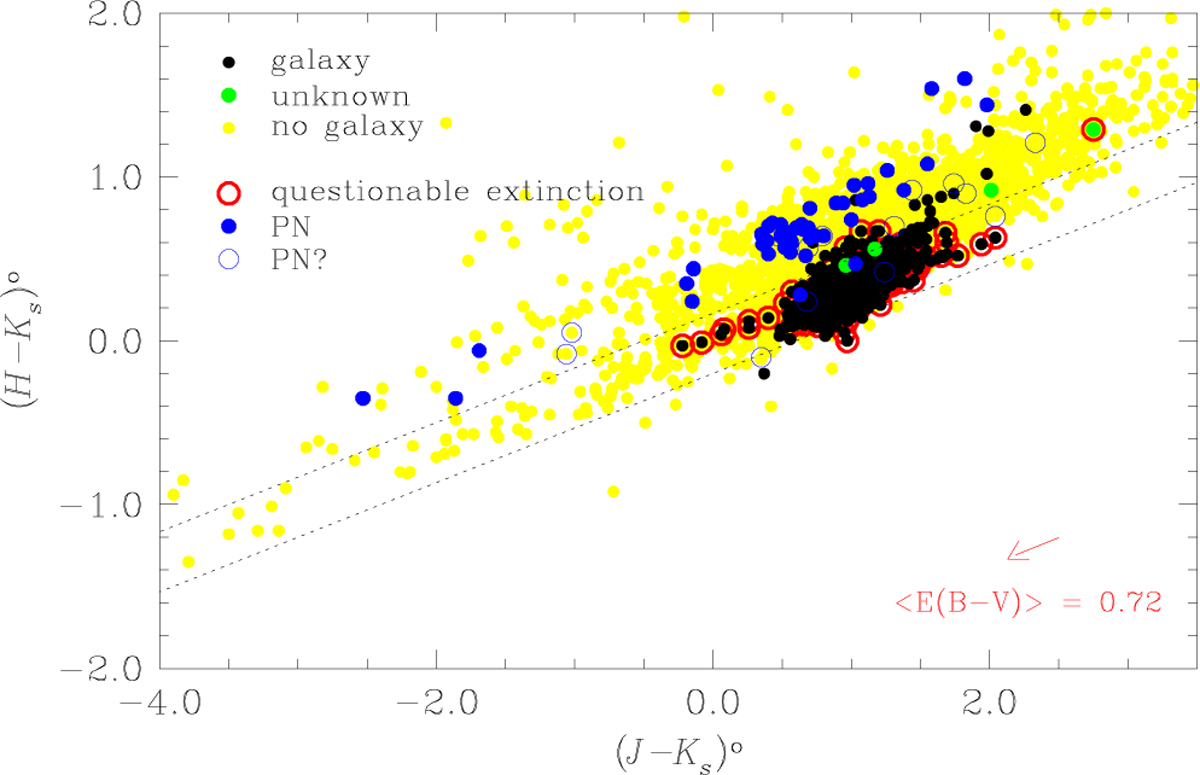
2MASS extinction-corrected colour–colour plot, (H − Ks)o versus (J − Ks)o. A reddening vector, representing the mean of the sample shown, is indicated by a red arrow in the bottom right corner. The reddening path for objects within the intrinsic colour range of galaxies is indicated with two parallel dashed lines.
Current usage metrics show cumulative count of Article Views (full-text article views including HTML views, PDF and ePub downloads, according to the available data) and Abstracts Views on Vision4Press platform.
Data correspond to usage on the plateform after 2015. The current usage metrics is available 48-96 hours after online publication and is updated daily on week days.
Initial download of the metrics may take a while.