Open Access
Fig. 13
Download original image
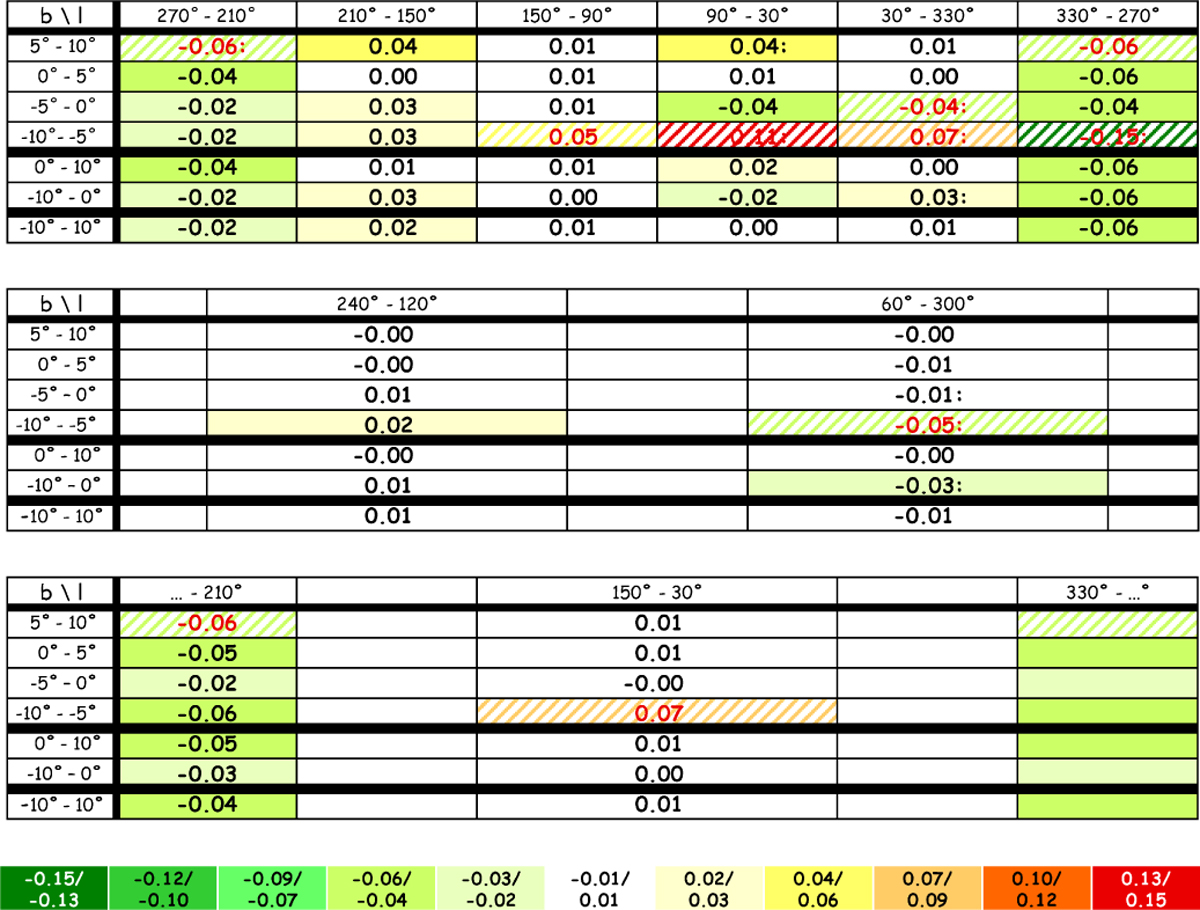
Binned sky map with Δfa-values (fcell − fall) per cell. The colour scale is shown at the bottom. Red numbers may be overestimated, and colons indicate uncertain values. The 330°−210° cells are wrapped around the Galactic Centre.
Current usage metrics show cumulative count of Article Views (full-text article views including HTML views, PDF and ePub downloads, according to the available data) and Abstracts Views on Vision4Press platform.
Data correspond to usage on the plateform after 2015. The current usage metrics is available 48-96 hours after online publication and is updated daily on week days.
Initial download of the metrics may take a while.