Fig. 3
Download original image
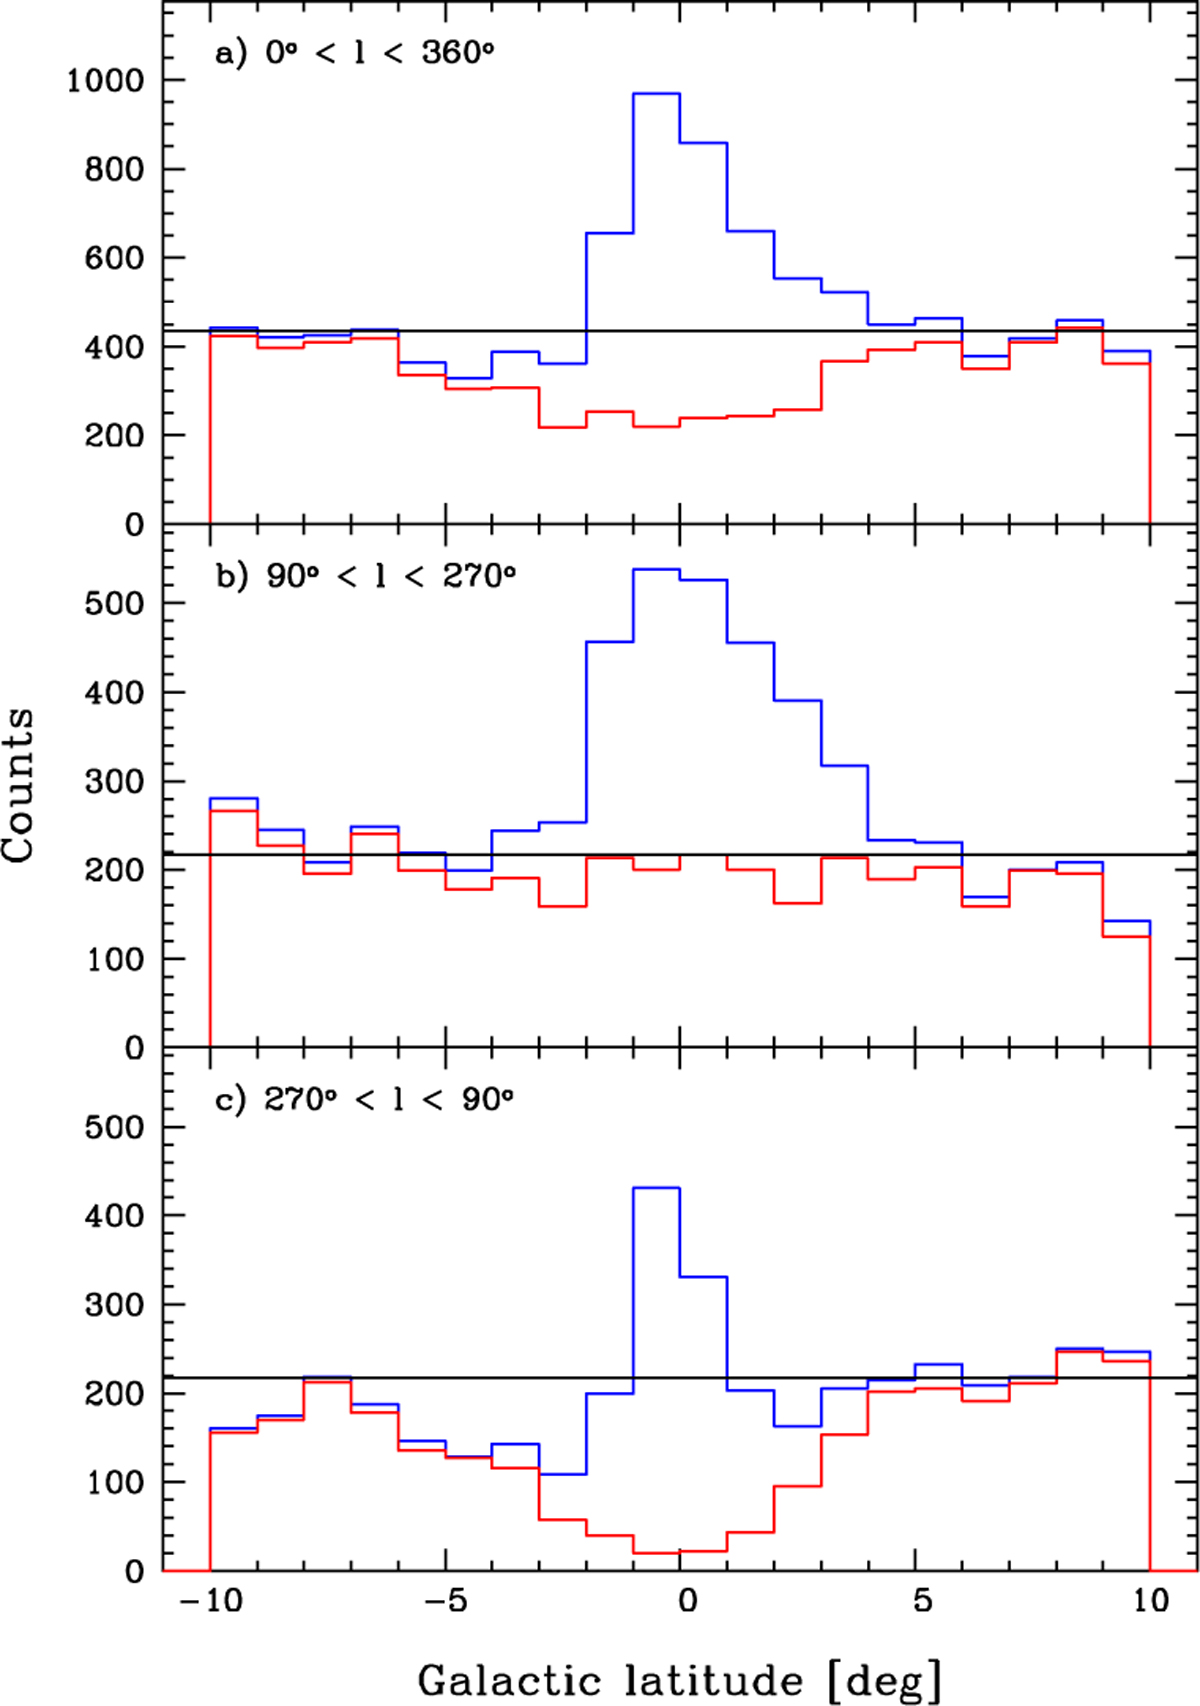
Histograms of objects in the ZOA sample as a function of Galactic latitude for all objects (blue) and for galaxies only (red). The black line represents the average 2MASX galaxy count outside the ZoA. Panel a: for all Galactic longitudes; panel b for the semi-circle towards the anti-centre region; panel c for the semi-circle towards the bulge.
Current usage metrics show cumulative count of Article Views (full-text article views including HTML views, PDF and ePub downloads, according to the available data) and Abstracts Views on Vision4Press platform.
Data correspond to usage on the plateform after 2015. The current usage metrics is available 48-96 hours after online publication and is updated daily on week days.
Initial download of the metrics may take a while.