Open Access
Fig. 7
Download original image
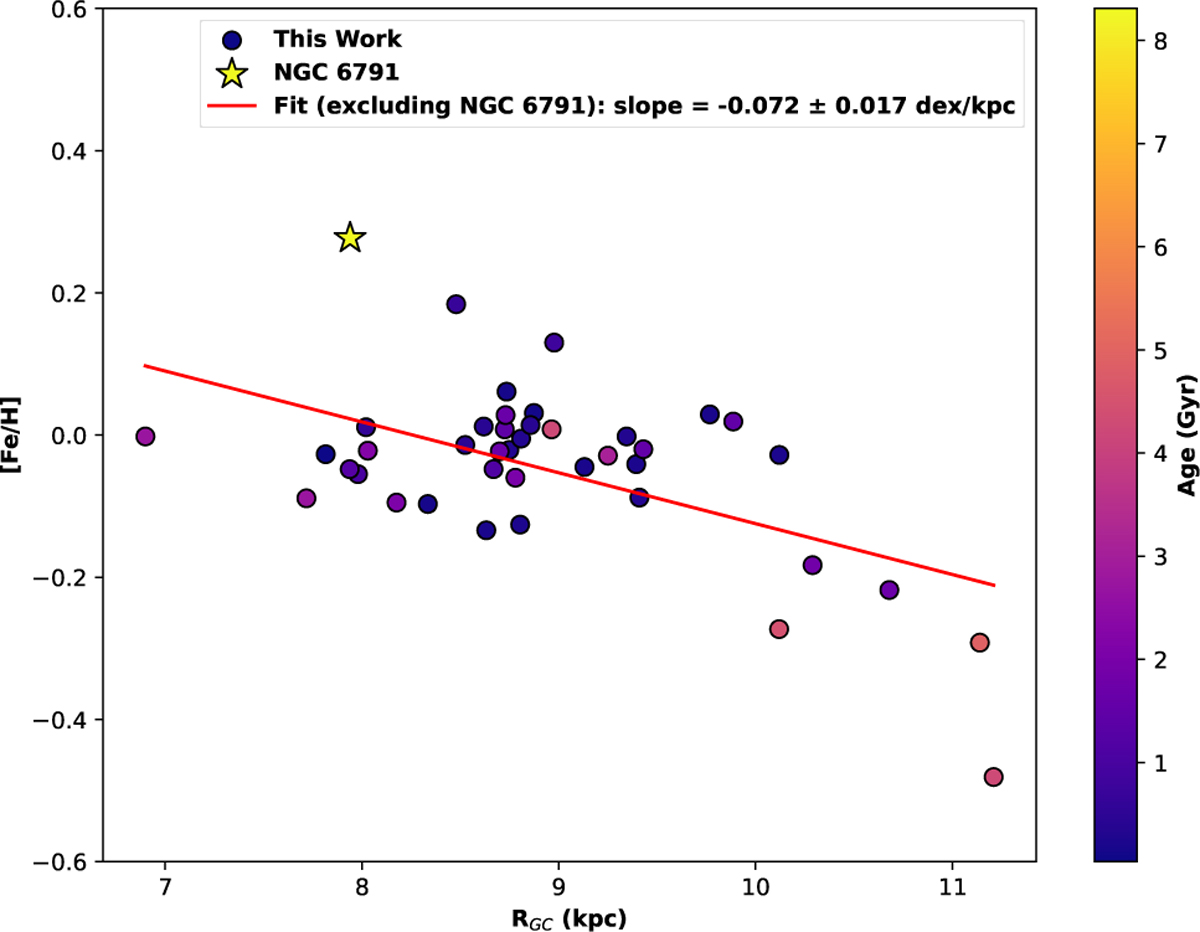
[Fe/H] vs. Rgc for our clusters. Each point is color-coded according to cluster age (in Gyr), as indicated by the color bar. The red line indicates the linear fit, with the exclusion of NGC 6791 (denoted by a star symbol). The derived slope and its uncertainty are indicated in the legend.
Current usage metrics show cumulative count of Article Views (full-text article views including HTML views, PDF and ePub downloads, according to the available data) and Abstracts Views on Vision4Press platform.
Data correspond to usage on the plateform after 2015. The current usage metrics is available 48-96 hours after online publication and is updated daily on week days.
Initial download of the metrics may take a while.