| Issue |
A&A
Volume 704, December 2025
|
|
|---|---|---|
| Article Number | A220 | |
| Number of page(s) | 18 | |
| Section | Galactic structure, stellar clusters and populations | |
| DOI | https://doi.org/10.1051/0004-6361/202557208 | |
| Published online | 18 December 2025 | |
Stellar population astrophysics (SPA) with the TNG
23 IR elemental abundances of 114 giant stars in 41 open clusters
1
Materials Science and Applied Mathematics, Malmö University,
205 06
Malmö,
Sweden
2
Nordic Optical Telescope,
Rambla José Ana Fernández Pérez 7,
38711
Breña Baja,
Spain
3
Department of Physics, University of Rome Tor Vergata,
via della Ricerca Scientifica 1,
00133
Rome,
Italy
4
INAF-Osservatorio Astronomico di Padova,
vicolo dell’ Osservatorio 5,
35122
Padova,
Italy
5
Dept. of Astronomy & McDonald Observatory, The University of Texas at Austin,
2515 Speedway,
Austin,
TX
78712,
USA
6
INAF-Osservatorio di Astrofisica e Scienza dello Spazio di Bologna,
via Piero Gobetti 93/3,
40129
Bologna,
Italy
7
Department of Astronomy, Stockholm University, AlbaNova University Center,
Roslagstullsbacken 21,
114 21
Stockholm,
Sweden
8
INAF – Osservatorio Astronomico di Roma,
via Frascati 33,
00178
Monte Porzio Catone,
Italy
9
Fundacíon Galileo Galilei - INAF,
Rambla José Ana Fernández Pérez 7,
38712,
Breña Baja,
Tenerife,
Spain
★ Corresponding author: This email address is being protected from spambots. You need JavaScript enabled to view it.
Received:
11
September
2025
Accepted:
1
November
2025
Abstract
Context. Open clusters have been extensively used as tracers of Galactic chemical evolution, as their constituent stars possess shared characteristics, including age, Galactocentric radius, metallicity, and chemical composition. By examining the trends of elemental abundances with metallicity, age, and Galactocentric radius, valuable insights can be gained into the distribution and nucleosynthetic origins of chemical elements across the Galactic disk. The infrared domain in particular facilitates the observation of some elemental abundances that can be challenging or impossible to discern in the optical; for example, K and F.
Aims. The objective of this study is to derive the stellar parameters and elemental abundances of up to 23 elements in 114 stars spanning 41 open clusters using high-resolution infrared spectroscopy. In addition, the present study aims to examine the chemical evolution of the Galactic disk. This is achieved by investigating radial abundance gradients, variations in abundance between clusters, and the dependence of chemical abundances on the cluster age.
Methods. The spectra utilized in this study were obtained with the high-resolution near-infrared GIANO-B spectrograph at the Telescopio Nazionale Galileo. The derivation of stellar parameters and chemical abundances was achieved by employing the Python version of Spectroscopy Made Easy. In the H-band region, a combination of atomic and molecular features was utilized to constrain the stellar parameters, including OH, CN, and CO molecular lines, and Mg I, Si I, Ti I, Ti II, C I, and Fe I atomic lines.
Results. Abundances for up to 23 elements, C, N, F, Na, Mg, Al, Si, S, K, Ca, Ti, V, Cr, Mn, Fe, Co, Ni, Cu, Zn, Y, Ce, Nd, and Yb, were derived and compared with available literature values where possible. Non-local thermodynamic equilibrium analysis was utilized for the elements C, Na, Mg, Al, Si, S, K, Ca, Ti, Mn, Fe, and Cu. For each element, Galactic trends were examined by analyzing both [X/Fe] and [X/H] as functions of [Fe/H], stellar age, and Galactocentric radius. In particular, the radial abundance gradient of Ytterbium is presented for the first time, thereby extending the observational constraints on heavy neutron-capture elements.
Conclusions. Radial abundance gradients for a wide range of elements in the Galactic disk are found, with [X/Fe] slopes ranging from −0.061 to +0.065 dex/kpc. The observed gradients are consistent with an inside-out formation scenario for the Galactic disk, wherein chemical enrichment proceeds from the inner regions to the outer ones over time. The observed [X/Fe] trends across multiple nucleosynthetic groups, including α elements, odd-Z elements, iron-peak elements, and neutron-capture elements such as Y, Ce, Nd, and Yb, reflect the diverse production sites and timescales associated with each group. In particular, the positive [Zn/H] and [Zn/Fe] gradients suggest a distinctive nucleosynthetic origin for Zn, possibly linked to metallicity-dependent yields. The positive gradient in [Yb/Fe] (0.065 ± 0.031 dex/kpc) provides significant new constraints on neutron-capture enrichment processes and the chemical evolution of the Galactic disk.
Key words: Sun: fundamental parameters / stars: abundances / stars: atmospheres / Galaxy: disk / Galaxy: evolution / open clusters and associations: general
© The Authors 2025
 Open Access article, published by EDP Sciences, under the terms of the Creative Commons Attribution License (https://creativecommons.org/licenses/by/4.0), which permits unrestricted use, distribution, and reproduction in any medium, provided the original work is properly cited.
This article is published in open access under the Subscribe to Open model. This email address is being protected from spambots. You need JavaScript enabled to view it. to support open access publication.
1 Introduction
The derivation of chemical abundances of different elements is of great importance in tracing the chemical evolution of our Galaxy. Moreover, in order to achieve a comprehensive understanding of this process of Galactochemical evolution, it is essential to analyze a diverse range of stars, with different ages, Galactocentric radii and metallicities. In recent years, several studies have been conducted in the optical range, which have contributed to the derivation of chemical abundances. However, the study of chemical evolution has also made significant progress in the near-infrared (NIR) spectral range, with the inclusion of stars in dusty regions that would otherwise have obscured optical photons. The study of α and neutron capture elements in the NIR region (see e.g. Montelius et al. 2022; Nandakumar et al. 2024 and references therein) has facilitated our understanding of Galactic chemical evolution. Large-scale spectroscopic surveys, such as Apache Point Observatory Galactic Evolution Experiment (APOGEE, Majewski et al. 2017), have also been instrumental in this regard, providing high-resolution NIR spectra and abundances of several key elements across many major Galactic components.
The advancement of our comprehension of stellar - as well as Galactic - structure and evolution has been significantly enhanced by the insights gained from the study of star clusters. Among the various types of star clusters, open clusters (OCs) play a crucial role in our understanding of the characteristics of the low-α disk within galaxies. These clusters comprise stars that formed almost simultaneously, from a single molecular cloud, and therefore exhibit the same chemical composition (Spina et al. 2021 and references therein). Hence, by examining only a small fraction of their members, it is possible to gain a comprehensive understanding of the cluster’s chemical composition. This makes it relatively straightforward to gather data from extensive OC samples. Another advantage of OCs is that their ages and distances can be determined with good precision (e.g., Bragaglia & Tosi 2006; Bossini et al. 2019; Cantat-Gaudin et al. 2020). Consequently, they represent the optimal choice for determining the abundances of diverse elements in stars situated at varying distances from the Galactic center, in disparate azimuthal directions, and at disparate ages.
Despite comprehensive spectroscopic surveys such as Gaia-European Southern Observatory (Gaia -ESO), APOGEE, and GALactic Archaeology with HERMES (GALAH) (see, e.g., Randich et al. 2022; Donor et al. 2020; Spina et al. 2021) having sub-projects geared toward OCs, the accuracy and precision of the abundances from these industrial analysis pipelines still leave room for dedicated, smaller-scale projects based on more classical analysis methods, which can explore OCs in greater depth. One such study is Open Cluster Chemical Abundances from Spanish Observatories (OCCASO) (Carbajo-Hijarrubia et al. 2024), in which 36 OCs were analyzed using different spectrographs with R > 60 000. Another such project is One Star to Tag Them All (OSTTA), which employed the FIES spectrograph at the Nordic Optical Telescope (NOT) (R = 65 000), determining chemical abundances for about 20 poorly studied OCs (Carrera et al. 2022), and has data for more OCs obtained with UVES at the ESO VLT.
The Stellar Populations Astrophysics (SPA) project at the Italian Telescopio Nazionale Galileo (TNG), which employed the HARPS-N and GIANO-B echelle spectrographs, is aligned with these smaller-scale initiatives. The present study is a component of the SPA-OC series, which is designed to derive stellar parameters and abundances of stars in OCs. By comparing the metallicity, age, and Galactocentric distance of a given cluster with the abundance of different elements, one can construct a comprehensive picture of the origin and evolution of these elements across the Galactic disk. A number of other works have been published as part of the SPA-OC series, which analyze giant and main sequence stars: Frasca et al. 2019; D’Orazi et al. 2020; Casali et al. 2020; Alonso-Santiago et al. 2021; Zhang et al. 2021, 2022; Bijavara Seshashayana et al. 2024a; Dal Ponte et al. 2025. Dal Ponte et al. (2025) used optical spectra of 95 stars in 33 OCs to determine NLTE stellar parameters and abundances but in contrast we focus exclusively on NIR spectra.
In the present study, the IR abundances of 23 elements for 114 red clump and giant stars in 41 OCs are presented. These abundances were determined using spectra from the highresolution NIR spectrograph GIANO-B. This analysis establishes one of the most extensive and homogeneous databases of its kind among “non-industrial” projects to date. For example, this project is the first to determine elemental abundances in the IR for several clusters, including NGC 7086, UBC 60, UBC 141, UBC 169, UBC 170, and UBC 577. The dataset presented here has a wide age range, from 40 Myr up to 8.3 Gyr, and covers Galactocentric distances (Rgc) from 6.5 to 11.5 kpc. This enhanced SPA-sample facilitates investigation of the chemical evolution of the Galactic disk with unprecedented detail in the NIR, across a wide array of elements: C, N, F, Na, Mg, Al, Si, S, K, Ca, Ti, V, Cr, Mn, Fe, Co, Ni, Cu, Zn, Y, Ce, Nd, and Yb.
2 Observations
The data were collected with the 3.5-meter Telescopio Nazionale Galileo (TNG) located at the Observatorio del Roque de los Muchachos on La Palma (Canary Islands, Spain). The telescope has one high-resolution optical spectrometer, the High Accuracy Radial Velocity Planet Searcher for the Northern Hemisphere (HARPS-N) with R = 115 000, λλ = 3800-6900 Å, (Cosentino et al. 2014), and one high-resolution NIR spectrometer, GIANO-B, with R = 50 000, λλ = 0.97 - 2.5 μm. These instruments were used at the same time in GIARPS (GIANO-B + HARPS-N) mode (Oliva et al. 2012a,b; Origlia 2014; Claudi et al. 2017) during most SPA-observations, but this work pertains exclusively to analysis of the NIR portion. We refer to Dal Ponte et al. 2025 and references therein for the analysis of the optical spectra. The observations were conducted between July 2018 and April 2023. The GOFIO software was used to reduce the spectra (Rainer et al. 2018). This process encompasses the removal of the effects of defective detector pixels, the subtraction of the sky and dark frames, the application of flat-fielding, the optimization of spectrum extraction, and the calibration of wavelengths.
The later data reduction steps were done in the same way as presented in Jian et al. (2025, in review; Section 2.1). This included continuum normalization and telluric absorption correction. We used the TelFit package to find the best-fit synthetic telluric spectra for each order, and removed those feature by dividing the observed spectra with the telluric synthetic ones. Certain wavelength regions (13 530-14 350 Å and 18 020-19 400 Å) are heavily affected by telluric features and they are excluded in the following analysis.
Table A.1 presents a comprehensive overview of the characteristics of the stellar clusters in question. This includes their respective names, the number of stars observed within each cluster, their ages, Rgc, and the extinction.
3 Analysis
The determination of stellar parameters and elemental abundances was achieved through fitting of synthetic spectra to observed spectra, employing the χ2-minimization technique within predefined regions, using the Python version of Spectroscopy Made Easy (PySME v.0.4.188) (Piskunov & Valenti 2017; Wehrhahn et al. 2023). The selection of a relevant stellar atmosphere model was achieved through the interpolation in a grid of 1D Model Atmospheres in a Radiative and Convective Scheme (MARCS, Gustafsson et al. 2008). NLTE corrections were applied to atomic spectral lines for C, Na, Mg, Al, Si, S, Ca, K, Ti, Mn, Fe, and Cu (Amarsi et al. 2020; Mallinson et al. 2024; Caliskan et al. 2025).
The atomic data employed in this study is the same as used in (Montelius et al. 2022; Nandakumar et al. 2023a,b, 2024), so we refer to those papers for a more in-depth description. In short, this line list is based on data from the VALD database (Piskunov et al. 1995; Kupka et al. 2000; Ryabchikova et al. 2015), with astrophysical adjustment of the log(gf) values of several atomic lines. A listing of the atomic data used in the present work is shown in Table B.1.
3.1 Stellar parameters
The initial step in an abundance analysis of stellar spectra entails the determination of stellar parameters, including effective temperature (Teff), surface gravity (log g), metallicity ([Fe/H]), microturbulence (vmic), and macroturbulence (vmac). Accurate parameter determination is paramount for ascertaining the abundances of specific elements. The method presented in this paper is applicable to giants with 3500 < Teff < 5500 K. The present study’s methodology has been devised through the consideration of analogous methodologies with Nandakumar et al. (2023a) and Bijavara Seshashayana et al. (2024b).
The values for Teff, [Fe/H], vmic, vmac, as well as abundances of C, N, Mg, Si, and Ti were all kept as free parameters in PySME while fitting parts of the spectra covering temperaturesensitive OH, CO, and CN molecular lines and band heads, and atomic lines of C I, Mg I, Si I, Ti I, Ti II, and Fe I. Regarding log g, it was not a free parameter in the spectrum fitting; rather, it was a so called “derived parameter” in PySME, and was calculated based on the age, mass, distance, visual extinction (AV), and G magnitude using photometric approaches while the other parameters mentioned above were optimized. The method combined the theoretical isochrones with observational data to derive log g. The selection of an appropriate isochrone was based on the age and [Fe/H] of the star in question, with the MIST model grid (Paxton et al. 2015; Dotter 2016; Choi et al. 2016) being utilized for this purpose. The point on the isochrone that corresponds to the fit effective temperature was identified to get a mass-estimate for the star. The absolute G magnitude was computed by utilizing the observed G-band magnitude of the star, the distance to the cluster, and the cluster reddening (Cantat-Gaudin et al. 2020; Brogaard et al. 2021). The interstellar reddening was calculated by converting the visual extinction, Av, to color excess E(B - V) using the standard total-to-selective extinction ratio Rv = 3.1, following the extinction law of Cardelli et al. (1989). A bolometric correction was then applied (Casagrande & VandenBerg 2018a,b) to ultimately yield the bolometric magnitude and, consequently, the stellar luminosity. The surface gravity was then finally calculated using the following relation:
 (1)
(1)
where the solar reference values are log g⊙ = 4.44, M = 1 M⊙, and T⊙ = 5777 K.
Given that the present stellar sample includes both red giant branch and red clump stars, this method provides a consistent and reliable approach for estimating log g across different evolutionary phases (as opposed to the isochrone method used in, for example, Bijavara Seshashayana et al. 2024b).
Similarly, [O/Fe] was set to be a PySME “derived parameter”, following [Mg/Fe]. This approach is motivated by the shared nucleosynthetic origin of (the lightest) α elements, which are almost entirely produced in core-collapse supernovae. In stars that are too warm to exhibit any OH-lines, direct measurements for constraining O are not possible. Therefore, aligning [O/Fe] with [Mg/Fe] helps maintain a physically motivated chemical pattern (Woosley & Weaver 1995; Nomoto et al. 2013; Kobayashi et al. 2020).
The stellar parameters derived for all 114 stars from 41 clusters are shown as Kiel diagrams in Figures C.1-C.2. These Figures presents our sample data alongside stellar parameters from Dal Ponte et al. (2025), including both overlapping stars and those unique to each dataset. The corresponding isochrones of the same age and metallicity as the clusters are taken from the MIST database.
The atomic and molecular lines utilized to derive the stellar parameters are presented in Table B.1, while the derived stellar parameters can be found in Table C.1. This table includes the formal fit uncertainties from PySME for each parameter across all stars. The average uncertainties for Teff, log g, [Fe/H], vmic, and vmac are 18 K, 0.1 dex, 0.02 dex, 0.07 km/s, and 0.17 km/s, respectively. These uncertainties reflect the random variation associated with the stellar parameters, arising from factors such as the signal-to-noise ratio (S/N), potential issues with χ2 minimization, and, to some extent, continuum normalization. In contrast, the often significantly larger systematic uncertainties, which originate from aspects such as model atmospheres and atomic data, remain much more challenging to quantify. Since log g was determined using isochrones, the uncertainties were estimated by propagating errors in Teff (fit uncertainties) through the standard relation for log g based on stellar parameters. A comparison of our determined stellar parameters with findings from a few other studies is discussed in Section 4.2.
3.2 Elemental abundances
The next step in the analysis was to measure the elemental abundances, adopting the determined stellar parameters. This was also done using PySME to vary the abundance in question to optimize the fit of the synthetic spectrum to the observed. One element at the time was fit, and in total up to 23 elements were determined in every star.
For some spectra, the analysis was not applied to specific elements due to the unavailability of measurable lines, a too-low S/N, or significant telluric contamination. The number of stars included in the determination of each element are listed in Table D.1.
The values of [X/Fe] for all analyzed elements in the individual stars are presented in Tables D.2-D.3, along with their formal fit uncertainties from PySME. Similar to the stellar parameters, these uncertainties reflect random variations primarily caused by factors such as the S/N. Systematic uncertainties in stellar abundances typically surpass these random errors and are mainly driven by inaccuracies in stellar parameters and atomic data. To mitigate the influence of atomic data inaccuracies, we have utilized rigorously vetted and astrophysically adjusted atomic data, as is detailed above. The mean cluster abundances listed in Tables D.4-D.6 demonstrate intra-cluster variations generally ranging from 0.01 to 0.10 dex, with only a few cases reaching 0.15 dex, thereby reinforcing the reliability of our abundance determinations.
All our abundance results are compared with [Fe/H], age, and Rgc in Figures 1-6. These trends, visible for individual elements, provide valuable insights into the chemical evolution and spatial structure of the Milky Way’s disk population.
4 Results and discussion
The derived abundances for each cluster is listed in Tables D.4-D.6, and the abundance trends are plotted compared with [Fe/H], age, and Rgc in Figures 1-6. The quoted uncertainties represent the error on the mean abundance (
 ), except for clusters with only one observed star. In such cases, representative uncertainties were estimated based on the average uncertainties from clusters with multiple stars. All abundance ratios are scaled relative to the solar values as reported by Asplund et al. (2021). The [X/H] versus Rgc slopes for all elements in our sample and many of the literature values discussed below are listed in Table 1.
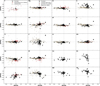 |
Fig. 1 Mean cluster abundance ratios as a function of [Fe/H]. The black markers are from the present work, with the black star indicating the OC NGC 6791. The red squares are from Dal Ponte et al. (2025), and orange triangles are from Myers et al. (2022) for all elements but F. For F, red squares are from Bijavara Seshashayana et al. (2024a); Bijavara Seshashayana et al. (2024b), orange triangles are all other literature OCs with determined F abundances (for more information, see Bijavara Seshashayana et al. 2024a; Bijavara Seshashayana et al. 2024b). |
4.1 A special cluster: NGC 6791
NGC 6791 is considered to be among the oldest OCs of the Galaxy. In their seminal work, Brogaard et al. (2021), definitively established an age of 8.3±0.3 Gyr, a conclusion that was reached through the meticulous analysis of multiple eclipsing binaries. This is the most robust determination and should be preferred to the values in Cantat-Gaudin et al. (2020) or Hunt & Reffert (2023). The metallicity of this cluster has been determined by multiple authors using both photometry (e.g., Brogaard et al. 2021, who found a metallicity of 0.3), and spectroscopy, with values ranging from approximately 0.2 to over 0.4 dex (e.g., Casamiquela et al. 2017; Gratton et al. 2006, respectively). Our [Fe/H] value of 0.28±0.03 dex is in very good agreement with previous values, including Bijavara Seshashayana et al. (2024a).
Given its very high metallicity and its current Rgc, it has long been suspected that NGC 6791 formed much closer to the Galactic center before migrating outward. For example, Jílková et al. (2012) proposed a migration from an inner-disk position (Rgc of 3-5 kpc) to the current value of approximately 8 kpc. Additionally, its large orbital eccentricity and distance from the Galactic plane, coupled with its metallicity and [α/Fe] greater than solar (see, for example, Viscasillas Vázquez et al. 2022), make this cluster an outlier. Hence, NGC 6791 has been excluded from all slope calculations presented in the following subsections and figures, in order to avoid skewing the derived abundance trends.
Comparison of Galactic abundance gradients (slopes in dex/kpc) for [X/H] vs. Rgc from this work and selected literature sources.
4.2 Comparison of parameters and abundances with literature values
The majority of the OCs analyzed in this study have already been investigated in previous works based on optical spectra from the SPA project, including Casali et al. (2020), Zhang et al. (2021), Zhang et al. (2022), Alonso-Santiago et al. (2021), and Dal Ponte et al. (2025). There are also OCs from our sample in common with studies, such as OCCASO (Casamiquela et al. 2017, 2019), see below. Furthermore, the OCCAM-project within the APOGEE survey has examined a sample of stars in 150 clusters in the IR region (Myers et al. 2022), with nine of these clusters overlapping with our sample.
In order to evaluate the consistency and discrepancies between our analysis and existing literature, we compared our stellar parameters, Teff, log g, and [Fe/H] - for stars in common with other datasets. The differences were calculated on a star-by-star basis as the mean difference (this work - literature) per cluster, with uncertainties expressed as standard deviations. As is demonstrated in Table C.2, this reveals a range of discrepancies between this work and previous studies. The offsets are generally modest (typically ≤100 K in Teff, 0.3 dex in log g, and 0.1 dex in [Fe/H]). However, the differences in log g are sometimes larger, reflecting the general difficulty of determining this parameter accurately. In a number of cases, and especially in comparison with Zhang et al. (2021), the discrepancies are even more marked, with one star displaying a difference of 1.56 dex in log g. These larger offsets likely arise from the differing methods used to derive log g: Zhang et al. (2021) determined log g spectroscopically from ionization balance, whereas in the present work, log g was computed photometrically by combining isochrone-based mass estimates with cluster distances and extinction corrections. Additional differences in adopted line lists, model atmospheres, and reference solar abundances may also contribute to the systematic offsets. When it comes to our SPA-companion-paper Dal Ponte et al. (2025), the derived stellar parameters are however in general very similar. Since our analysis is based on IR data, whereas Dal Ponte et al. (2025) utilized optical spectra this strong agreement underscores the reliability of the derived stellar parameters.
To contextualize our IR elemental abundance results, we compare our data primarily with the OCCAM project within APOGEE (DR17, Myers et al. 2022), which is based on highresolution H-band spectra analyzed using an industrial pipeline (ASPCAP) and is thus directly comparable to our work in terms of wavelength coverage, stellar parameter sensitivity, and potential systematics. Since our analysis is based on IR spectra, we deliberately avoid combining our results with optical-only surveys unless explicitly stated. However, we include Dal Ponte et al. (2025) in our plots as a relevant optical counterpart, as being a SPA paper, also based on observations from the TNG and target similar stellar populations. In specific cases where IR data are lacking for certain elements or clusters, we include results in the discussion section only and not in plots, from well-characterized optical surveys such as OCCASO (Carbajo-Hijarrubia et al. 2024) and Gaia-ESO (Magrini et al. 2023). Cross-validating results across these wavelength regimes enhances confidence in the derived chemical signatures and their application to tracing the chemical enrichment of the Milky Way.
For the [X/Fe] values, we compared with Dal Ponte et al. (2025) and APOGEE DR17 (Myers et al. 2022). The comparison with Dal Ponte et al. (2025) was carried out using 29 clusters and for Mg, Si, Ti, Na, Al, Mn, Co, Ni, and Y. There is a general consensus for the majority of species. The median absolute difference (|∆[X/Fe]|) is typically ≤0.07 dex for α elements and for Fe-peak elements, suggesting a consistent abundance scale despite methodological differences. Larger, though still systematic, offsets were observed for the neutroncapture element Y. This may be attributed to the use of NLTE corrections in Dal Ponte et al. (2025), as opposed to the LTE assumptions adopted in this work. The element Na displays only negligible star-to-star scatter, suggesting that its abundance remains relatively consistent across the sample (approximately 0.08-0.10 dex).
In the case of APOGEE DR17, 14 elements overlap with our work: Na, Mg, Al, Si, S, K, Ca, Ti, V, Cr, Mn, Co, Ni, and Ce. The agreement is encouraging, with the majority of ∆[X/Fe] values falling within ±0.05 dex.
Despite inherent differences in wavelength coverage, data reduction techniques, and analysis pipelines, the abundance patterns derived from the three independent datasets - ours, Myers et al. (2022), and Dal Ponte et al. (2025) - exhibit broad concordance. For clusters common to our study and Dal Ponte et al. (2025) - such as Alessi 1, Basel 11b, and Gulliver 18 - the mean abundance differences in key elements including Mg, Si, Ca, and Fe typically lie within ±0.05 dex. It is notable that these offsets are comparable to, or smaller than, the combined uncertainties of the measurements. Some minor systematic deviations are apparent, such as slightly lower Mg and Si abundances in our data for Alessi Teutsch 11 relative to Dal Ponte et al. (2025), and modest differences in S and Na for select clusters. Although our analysis yields very small formal uncertainties, these mainly reflect the fitting procedure and do not fully account for systematic effects.
A more representative measure of precision is the internal abundance scatter within a cluster, which we use for comparison across studies. The close correspondence in abundance trends between the two datasets provides compelling evidence for the robustness of the analytical approach. The minor residual discrepancies can be attributed to variations in line lists, analytical methods, or the criteria employed for sample selection.
The mean cluster abundances obtained in this study also demonstrate excellent agreement with those reported by Myers et al. (2022), with mean differences across key elements typically within ±0.02 dex. However, it is important to note that the internal uncertainties representing cluster abundance spreads in our analysis are on average approximately 40% smaller than those presented by Myers et al. (2022). This substantial reduction in internal dispersion is consistent across all elements studied and attests to the enhanced precision and robustness of the methodology employed.
Our derived radial metallicity gradient is −0.079 ± 0.018 dex/kpc including NGC 6791 and −0.072 ± 0.017 dex/kpc excluding NGC 6791 (see Figure 7), aligning well with values reported in recent OC studies. For instance, Myers et al. (2022) found a similar slope of −0.073 ± 0.002dex/kpc within the range of 6-11.5 kpc and Spina et al. (2021) reported −0.076± 0.009 dex/kpc and these clusters are located at Rgc spanning approximately 6 to 16 kpc. These consistent findings across various datasets and methodologies reinforce the existence of a negative abundance gradient in the inner Galactic disk. The decrease in metallicity with Rgc is a well-established result, consistently confirmed over decades of OC studies. Beyond the distance of 11-13 kpc, a noticeable flattening of the gradient is frequently observed, with slopes tending toward zero Magrini et al. (2023).
The findings of this study emphasize the robustness of the metal-licity gradient and lend support to models of inside-out disk formation shaped by radial migration and external accretion. Recio-Blanco et al. (2023) utilized the Gaia-RVS to derive the metallicity gradient for almost 500 OCs, thereby further reinforcing the robustness of this result. Whilst it is acknowledged that only a limited number of studies have been referenced in this analysis, the general consensus is one of consistency. Another valuable approach to probing the properties of the Galactic disk using OCs is presented by Hu & Soubiran (2025), who utilized Gaia spectrophotometry to analyze a sample of approximately 600 OCs covering a wide range of distances and ages. A precise radial metallicity gradient was derived, which revealed a break at Rgc 10-12 kpc: the inner disk exhibits a steep slope of −0.084 ± 0.004 dex/kpc, while the outer disk shows a significantly flatter gradient of −0.018 ± 0.056 dex/kpc. In addition, they reported a vertical gradient of −0.415± 0.030 dex/kpc, highlighting the disk’s chemical stratification with height above the Galactic plane. We note that only a small subset of the extensive literature on metallicity gradients is presented here.
4.3 α elements (Mg, Si, S, Ca, and Ti)
The α elements are among the most studied elements in the context of Galactic chemical evolution. They are mainly synthesized in core-collapse supernovae (CCSNe), which originate from massive stars with masses ≳10 M⊙. Due to their short lifetimes, these stars rapidly enrich the interstellar medium (ISM) with α elements early in the history of the Galaxy. In contrast, iron is produced predominantly in Type Ia supernovae, which are produced by lower-mass progenitors and occur on longer timescales. This temporal difference leads to the well-known enrichment of [a/Fe] at low metallicities (Tinsley 1980; Matteucci & Greggio 1986).
Magnesium: the Mg I abundances were determined using four spectral lines in the H-band (for details, see Table B.1). NLTE synthesis was applied to all the Mg lines used, but a LTE synthesis would only render 0.03 dex higher [Mg/Fe] on average. Mg abundances were derived for all clusters in our sample, and the results are presented in Figures 1-6, where they are plotted and compared with literature values from Dal Ponte et al. (2025) and Myers et al. (2022). The [Mg/Fe] ratio shows a flat trend when plotted against Rgc (slope: 0.011 ± 0.006 dex/kpc), as expected for an a element such as Mg, which is produced predominantly in CCSNe early in the Galaxy’s history, leading to broadly uniform enrichment across the disk. The trend of [Mg/H] with Rgc reveals a clear negative gradient (−0.061 ± 0.016 dex/kpc), consistent with the metallicity gradient expected from inside-out disk formation. Our [Mg/Fe] measurement agrees with the Gaia -ESO slope of 0.008± 0.006 dex/kpc (Magrini et al. 2023) and with the OCCASO slope of 0.017± 0.011 dex/kpc (Carbajo-Hijarrubia et al. 2024). The overall agreement between our results and these previous studies supports the view that Mg, as a typical a element, is well mixed throughout the Galactic disk and does not display strong spatial variation.
Silicon: the Si I abundances were determined using nine spectral lines in the H-band region (see Table B.1). NLTE synthesis was applied to all the Si lines used, but a LTE synthesis would render 0.05 dex higher [Si/Fe] on average. We plot and compare our Si abundance results with those of Myers et al. (2022) and Dal Ponte et al. (2025), finding good agreement across the datasets. [Si/Fe] remains largely flat across [Fe/H] and age, with only a slight positive trend. This suggests that Si production, such as Mg, is closely tied to that of Fe over the evolution of the disk, though it may exhibit slight enhancements in the outer regions compared to the inner disk. [Si/H] displays a negative slope with Rgc (−0.044 ± 0.016 dex/kpc), again tracing the underlying metallicity gradient. The comparatively shallower gradient of [Si/H] with Rgc relative to that of [Mg/H] may reflect fundamental differences in their nucleosynthetic origins. While both elements are primarily produced in CCSNe, Mg is synthesized predominantly during hydrostatic burning in massive stars, whereas Si is formed largely through explosive O burning, making its yield more sensitive to progenitor mass and explosion energy (e.g. Woosley & Weaver 1995; Nomoto et al. 2013). Furthermore, Si has a modest contribution from Type Ia supernovae (e.g. Iwamoto et al. 1999; Kobayashi et al. 2020), which produce both Fe and Si but negligible Mg. This additional Si contribution acts to flatten the [Si/Fe] gradient, especially in the inner disk where the SN Ia rate is higher. Conversely, the outer disk, where the occurrence of SNe Ia is less prevalent, exhibits a more pronounced retention of pristine α element signatures. However, the [Si/Fe] gradient in this region remains less pronounced in comparison to that of [Mg/Fe]. For [Si/Fe] versus Rgc, our data yield a slope of 0.027 ± 0.010 dex/kpc, which is more positive than most previous studies. For instance, Myers et al. (2022) report values clustered around 0.011 ± 0.001 dex/kpc. The value reported by Magrini et al. (2023) in Gaia-ESO is 0.003 ± 0.010 . Carbajo-Hijarrubia et al. (2024) reported a value of 0.003 ± 0.003. The more positive trend observed in our sample could suggest a mild enhancement of Si in the outer disk. This may reflect variations in the star formation history, the initial mass function, or the role of Type II supernovae at larger radii. However, given the error bars, the difference between our result and those in the literature is not significant, and the overall [Si/Fe] gradient remains weak. This supports the broad conclusion of a chemically homogeneous thin disk for Si.
Sulfur: we derived S abundances using only one S I line at 15478.48 Å. NLTE synthesis was applied to the S line, and a LTE synthesis would render 0.06 dex lower [S/Fe] on average, indicating non-negligible NLTE-effects in our sample of stars. There are relatively few studies on S abundances in stars, partly due to the challenges associated with these NLTE sensitivities. In our sample, we rely on a single S line, which introduces larger uncertainties in the abundance measurements. Despite this, when uncertainties are taken into account, the [S/Fe] ratio shows a positive trend with Rgc (0.064 ± 0.024 dex/kpc), implying a possible slight enhancement in the outer disk. Our S abundances are systematically larger with those reported by Myers et al. (2022) as seen in Figures 1-6. The [S/H] trend with Rgc is nearly flat, with a weak negative slope (−0.007± 0.023 dex/kpc), suggesting that the absolute abundance decreases only slightly
with increasing Rgc. This behavior is somewhat unexpected, given that S is traditionally considered an α element and should therefore trace the trends seen for elements such as Mg or Si. The nearly flat [S/H] gradient exhibited in this study stands in contrast to the results obtained from Cepheid studies, including those by da Silva et al. (2023) and Trentin et al. (2024). These studies reported significantly steeper positive [S/H] gradients with Rgc for young stellar populations. One plausible explanation for this discrepancy lies in the age difference between the stellar populations being probed. Cepheid variables are relatively young, massive stars, with typical ages of only a few hundred million years. The OCs in our sample, on the other hand, span intermediate to old ages, thereby tracing earlier phases of the Galactic disk evolution. While Cepheids provide information on the most recent chemical enrichment, OCs offer a complementary, longer-term perspective. A steeper [S/H] gradient in the younger Cepheid population would suggest that S production (primarily from CCSNe) has become more concentrated toward the center in recent times. In other words, the outer disk has received less S enrichment. Alternatively, metallicity-dependent yields and diminished radial gas mixing could have steepened the gradient over time (e.g. Kobayashi et al. 2006; Prantzos et al. 2018). Conversely, it can be hypothesized that the results obtained from our OC sample may be indicative of an earlier phase of Galactic chemical evolution during which S was present but distributed differently across the disk (e.g., Matteucci 2001; Romano et al. 2010).
Calcium: Ca abundances were determined using seven H-and K-band lines (see Table B.1). NLTE synthesis was applied to all the Ca lines used, but a LTE synthesis would only render 0.01 dex higher [Ca/Fe] on average. One star, UBC_141_1, was excluded from the analysis, due to a low S/N ratio that rendered the Ca-lines unusable. We plot and compare our Ca abundance results with those from Myers et al. (2022) and Dal Ponte et al. (2025), which show good agreement. [Ca/Fe] shows no significant trend with Rgc (0.007 ± 0.009 dex/kpc), reflecting Ca being an a element produced in similar sites as Mg and Si. This finding is fully consistent with previous literature [Ca/Fe] values, including the studies by Reddy et al. (2016) (0.014± 0.005 dex/kpc), Magrini et al. (2023) (0.010± 0.007 dex/kpc), and Carbajo-Hijarrubia et al. (2024) (0.015± 0.005 dex/kpc) all of which reported very weak or negligible gradients for [a/Fe] versus Rgc. [Ca/H], however, decreases with increasing Rgc (−0.069 ± 0.017 dex/kpc), consistent with the overall negative metallicity gradient of the Galactic disk. The near-zero slope of [Ca/Fe] supports the idea that the level of enrichment relative to iron has remained consistent across the disk among the a elements, reflecting a well-mixed interstellar medium and comparable supernovae yields in various disk environments.
Titanium: Ti abundances were determined using five IR lines as shown in the table B.1 using both Ti I and Ti II lines. All stars in the sample were included in the analysis, and NLTE synthesis was applied to all the Ti lines used, but a LTE synthesis would only render 0.01 dex higher [Ti/Fe] on average. Our results are plotted with those from Dal Ponte et al. (2025) and Myers et al. (2022), showing consistent trends. The [Ti/Fe] ratios display a flat behavior as a function of Rgc, suggesting a steady production ratio over time and across different Galactic regions. This result is fully consistent with the findings of Myers et al. (2022), Magrini et al. (2023), and Carbajo-Hijarrubia et al. (2024) who report negligible gradients for [Ti/Fe] across the disk. [Ti/H] decreases with Rgc (−0.069 ± 0.018 dex/kpc), matching the metallicity gradient. These trends reflect the expected behavior of Ti as an element with contributions from CCSNe, becoming more enriched in regions closer to the Galactic center. The lack of a significant [Ti/Fe] gradient suggests that Ti, similarly to many other a elements, is well mixed in the Galactic thin disk, and its enrichment relative to Fe is uniform over large spatial scales.
In summary, the findings of this study demonstrate that the measurements for [Mg/Fe], [Si/Fe], [S/Fe], [Ca/Fe], and [Ti/Fe] versus Rgc are consistent with the prevailing consensus in the existing literature. The α-element abundances relative to iron remain relatively constant across the disk, exhibiting at most mild positive gradients for Si and S, and virtually no gradient for Mg and Ca. Whilst the overall trends are broadly similar to ours, the [X/Fe] values from Myers et al. (2022) exhibit significantly greater scatter across [Fe/H], age, and Rgc as seen from Figures 1-6. This is likely attributable to the industrial analysis approach in OCCAM and the absence of uniform NLTE corrections, both of which introduce uncertainties and inflate the observed dispersion. In contrast, the measurements presented in this study show tighter clustering and more well-defined trends. This reflects a more homogeneous analysis based on high-S/N spectra and carefully selected spectral lines. Notably, our results are in strong agreement with Dal Ponte et al. (2025) - the optical counterpart of this study - even though different methodologies and line data were employed, underscoring the robustness of the derived abundance patterns. These findings support the hypothesis of a chemically homogeneous thin disk for the elements considered here.
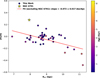 |
Fig. 7 [Fe/H] vs. Rgc for our clusters. Each point is color-coded according to cluster age (in Gyr), as indicated by the color bar. The red line indicates the linear fit, with the exclusion of NGC 6791 (denoted by a star symbol). The derived slope and its uncertainty are indicated in the legend. |
4.4 Odd-Z elements (F, Na, Al, and K)
We analyzed F, Na, Al, and K as representatives of the odd-Z elements. These elements are believed to be produced in both massive stars and asymptotic giant branch (AGB) stars. Their abundance can exhibit secondary behavior, meaning their production depends on the initial metallicity of the stellar environment. As a result, such abundances tend to increase with metallicity, showing higher values at higher [Fe/H] (Smiljanic et al. 2016).
Fluorine: continuing from two previous GIANO-B-based studies (Bijavara Seshashayana et al. 2024a; Bijavara Seshashayana et al. (2024b), F abundances were determined for two additional OCs in the present work: Collinder 350 and Gulliver 18. The analysis was performed using the HF R9 molecular line at 23 358.33 Å. Although widely adopted for F abundance studies, this line can suffer from blending and saturation in cool (Teff < 3500 K) and metal-rich ([Fe/H] > 0.0 dex) stars (see Nandakumar et al. 2023b); however, this does not affect our present analysis, as the stars analyzed in this paper are warmer (Teff > 4000 K). Our derived F abundances are in good agreement with both the literature sample of OCs and those analyzed in our earlier work. For further details on the methodology and comparative Galactic trends, we refer to Bijavara Seshashayana et al. (2024a); Bijavara Seshashayana et al. (2024b).
Sodium: Na abundances were derived using a combination of H- and K-band spectral lines (Table B.1). NLTE synthesis was applied to the Na lines used, but a LTE synthesis would render 0.20 dex higher [Na/Fe] on average, indicating significant NLTE-effects for our Na-lines in our sample of stars. Three stars - NGC_2509_18, NGC_2420, and Gulliver_24 - stand out with slightly lower Na abundances and larger associated uncertainties, likely due to spectral quality. The [Na/Fe] shows a mild negative trend with Rgc (−0.042 ± 0.022 dex/kpc), indicating that Na enrichment relative to iron may decrease with distance from the Galactic center. This trend is in decent agreement with previous studies for [Na/Fe] values, such as Myers et al. (2022), with −0.006 ± 0.007 dex/kpc, Magrini et al. (2023), with 0.003 ± 0.002 dex/kpc, and Carbajo-Hijarrubia et al. (2024) with −0.027 ± 0.008 dex/kpc. All of these literature values are consistent with our result within the stated uncertainties. The [Na/H] trend with Rgc is stronger, with a slope of −0.113 ± 0.028 dex/kpc, indicating a strong decline outward in the disk, reinforcing the trend of increasing Na enrichment toward the inner Galaxy. The presence of a negative gradient in the [Na/Fe] ratio with respect to Rgc may suggest that nucleosynthetic yields are metallicity-dependent. We also note a marginally higher [Na/Fe] ratio in younger OCs, consistent with previous findings (e.g. Smiljanic et al. 2016) that attribute such trends to evolutionary effects in giant stars. This behavior persists after excluding NGC 6791, which is chemically peculiar and significantly older than the rest of the sample. The observed trend could reflect variations in the evolution of massive stars or differences in Type II supernova contributions in the outer disk. However, this interpretation is complicated by the age-Rgc degeneracy, as older clusters are preferentially located at larger Rgc in our sample. This spatial-age correlation highlights the challenge of disentangling evolutionary effects from dynamical influences when interpreting radial abundance gradients.
Aluminium: Al abundances were determined using six spectral lines located in both H- and K-band regions. NLTE synthesis was applied to all the Al lines used, but a LTE synthesis would render 0.09 dex lower [Al/Fe] on average, indicating modest NLTE-effects for our Na-lines in our sample of stars. [Al/Fe] versus Rgc does not display a significant trend (0.006 ± 0.009 dex/kpc). Our results are plotted with those from Dal Ponte et al. (2025) and Myers et al. (2022), showing good agreement across the sample. Carbajo-Hijarrubia et al. (2024) reports a value of −0.001 ± 0.005 dex/kpc which is also in extremely good agreement with us. The [Al/Fe] value reported by the Gaia -ESO Survey (Magrini et al. 2023), 0.012 ± 0.004 dex/kpc, is in agreement with our result within the uncertainties. [Al/H], by contrast, shows a marked negative slope with Rgc (−0.069 ± 0.018 dex/kpc), similar to other metallicity indicators. This finding is consistent with most recent literature, which also reports flat gradients for [Al/Fe] across the Galactic disk. The lack of a significant [Al/Fe] gradient suggests that Al enrichment relative to Fe has remained uniform with increasing distance from the Galactic center, possibly reflecting well-mixed nucleosynthetic contributions from both CCSNe and Type Ia supernovae throughout the disk’s history.
Potassium: K abundances were derived using one spectral line at 15 168.40 Å. All clusters in our sample were analyzed for K, and NLTE synthesis was applied to all the K line, but a LTE synthesis would render 0.03 dex lower [K/Fe] on average. K has not been extensively studied in stellar abundance analyses, mainly due to observational challenges. In the optical, the strongest K I lines (at 7665 and 7699 Å) are often avoided because they are affected by interstellar absorption, lie in regions contaminated by telluric lines, and are typically strong and saturated, making them difficult to model accurately. In the IR, the 15 168.40 Å line is a viable alternative, but it is one of the few usable K lines and is often weak or mixed, especially in cool or metal-poor stars. Our results are primarily plotted with those from Myers et al. (2022), showing good agreement. The Galactic trends observed in our sample align well with expectations from chemical evolution models. [K/Fe] shows no significant gradient as a function of Rgc (−0.003± 0.012 dex/kpc), as in Myers et al. (2022) (0.004± 0.004 dex/kpc). Taken together, these results suggest that [K/Fe] does not show a strong gradient with Rgc. [K/H] shows a negative gradient with Rgc (−0.079 ± 0.019 dex/kpc), reflecting the disk’s metallicity structure. Positive trends with [Fe/H] and age are also observed.
In summary, our findings for [Na/Fe], [Al/Fe], and [K/Fe] versus Rgc are consistent with the majority of recent literature, which demonstrates either mild negative gradients or flat trends. Despite the overall abundance patterns being comparable, the [X/Fe] values reported by Myers et al. (2022) exhibit a noticeably higher degree of scatter when plotted against [Fe/H], stellar age, and Rgc, also for the odd-Z elements. In contrast, the data presented herein demonstrate more coherent trends and tighter groupings, likely a result of the more “classical” analysisapproach as compared to the industrial analysis of Myers et al. (2022). The chemical homogeneity of Al and K, in conjunction with the weak but potentially significant Na gradient, lends support to the hypothesis that these elements are well mixed in the Galactic thin disk, exhibiting only subtle variations that may be attributable to underlying disparities in stellar populations or the star formation history across the Galaxy.
4.5 Iron-peak elements (V, Cr, Mn, Co, and Ni)
The iron-peak elements are primarily formed in SNe Ia, which occur when a white dwarf in a binary system accretes material from its companion and eventually reaches a critical mass near the Chandrasekhar limit. This leads to a thermonuclear explosion that produces large amounts of iron (Fe) and other iron-peak elements (Whelan & Iben 1973; Iben & Tutukov 1984; Kobayashi et al. 2011, Kobayashi et al. 2020; Nomoto & Leung 2018). In this work, we analyzed V, Cr, Mn, Co, and Ni. Among these, Mn is particularly interesting, as its abundance trend is thought to depend on the nature and metallicity of the SN Ia progenitors (de los Reyes et al. 2020). While SNe Ia are the dominant source of Mn, CCSNe may also contribute-particularly at lower metallicities. However, the behavior of Mn with respect to metallicity remains debated, with various studies presenting differing trends (e.g., Battistini & Bensby 2015; Zasowski et al. 2019; Lomaeva et al. 2019; Montelius et al. 2022; Vasini et al. 2024; Nandakumar et al. 2024).
Vanadium: V abundances were derived using the H-band spectral line at 15 924.81 Å. The stars UBC577_2, IC_4756_10, IC_4756_6, and UBC141_1 were excluded from the analysis due to the absence of detectable V lines, attributed to low S/N in the relevant spectral regions. A comparison of our V abundances with those of Myers et al. (2022) indicates broadly consistent results, with differences remaining within the reported uncertainties. The [V/Fe] ratios exhibit a slightly positive trend with Rgc, with a best-fit slope of 0.023± 0.026 dex/kpc, indicating no significant radial gradient. In contrast, [V/H] shows a slight negative trend with Rgc, with a slope of −0.049 ± 0.030 dex/kpc, consistent with the general pattern of increasing V enrichment toward the inner Galaxy. Our results are consistent with the results of the OCCASO survey who reported a value of 0.001 ± 0.003 dex/kpc (Carbajo-Hijarrubia et al. 2024) for [V/Fe]. This is also consistent with the mild positive gradients and flat trend reported by Myers et al. (2022) and Magrini et al. (2023) respectively.
Chromium: Cr abundances were determined using two H-band spectral lines at 15 680.06 and 15 860.21 Å. A comparison of our Cr abundances with those of Myers et al. (2022) reveals consistent trends across the parameter space, with differences remaining within the uncertainties. The [Cr/Fe] ratios display a flat trend with [Fe/H], age, and Rgc, indicating a relatively uniform Cr-to-Fe production over time and across the disk. The best-fit slope for [Cr/Fe] versus Rgc is −0.004 ± 0.010 dex/kpc, while for [Cr/H] versus Rgc it is −0.076 ± 0.022 dex/kpc. This is broadly consistent, within the uncertainties, with several literature results. For example, Myers et al. (2022) give a slope for [Cr/Fe] to be −0.002 ± 0.005 dex/kpc. Gaia-ESO reported a flat trend (Magrini et al. 2023). Carbajo-Hijarrubia et al. (2024) reported a value of 0.010 ± 0.003 dex/kpc. These mostly flat or weakly sloped trends further support the notion that Cr and Fe are produced in similar astrophysical sites, leading to well-coupled evolution across the disk.
Manganese: Mn abundances were derived using two H-band lines at 15 217.74 and 15 262.49 Å. NLTE synthesis was applied to both Mn lines used, but a LTE synthesis would render 0.01 dex higher [Mn/Fe] on average. The results were plotted and compared with those from Dal Ponte et al. (2025) and Myers et al. (2022), showing good agreement. The [Mn/Fe] ratios exhibit flat trend with Rgc, indicating a relatively consistent Mn-to-Fe production ratio across the Galactic disk. In contrast, [Mn/H] shows a clear downward trend with Rgc, reflecting progressive chemical enrichment over time. The best-fit slope for [Mn/Fe] versus Rgc is −0.005 ± 0.013 dex/kpc, while for [Mn/H] versus Rgc it is −0.077 ± 0.020 dex/kpc. Literature [Mn/Fe] values, such as those of Myers et al. (2022) (−0.005 ± 0.002 dex/kpc), Magrini et al. (2023) (0.003 ± 0.010 dex/kpc), and Carbajo-Hijarrubia et al. (2024) (0.003 ± 0.002 dex/kpc), are consistent within uncertainties. The slight negative gradient that we derive suggests that Mn enrichment relative to Fe decreases marginally with increasing Rgc, possibly reflecting a metallicity-dependent nucleosynthetic origin for Mn or differences in Type Ia SN contributions across the disk.
Cobalt: Co abundances were determined using the H-band spectral line at 16757.64 Å. The full stellar sample was analyzed, and the results were plotted with those from Dal Ponte et al. (2025) and Myers et al. (2022), showing strong agreement across the datasets. The best-fit slope for [Co/Fe] versus Rgc is 0.024 ± 0.011 dex/kpc, while for [Co/H] versus Rgc it is −0.047 ± 0.015 dex/kpc, suggesting a mild decline in absolute Co abundances toward the outer disk. Our values are consistent within error bars with the small gradients found by Myers et al. (2022), Magrini et al. (2023), and Carbajo-Hijarrubia et al. (2024). The lack of a pronounced trend implies that Co and Fe are synthesized in similar proportions throughout the disk, resulting in a spatially uniform [Co/Fe] ratio.
Nickel: Ni abundances were determined using six H-band spectral lines as shown Table B.1. The full stellar sample was included in the analysis, and the results were plotted with those from Dal Ponte et al. (2025) and Myers et al. (2022), showing good overall agreement. The best-fit slope for [Ni/Fe] versus Rgc is −0.019 ± 0.012 dex/kpc, while for [Ni/H] versus Rgc it is −0.092 ± 0.018 dex/kpc, indicating a significant decrease in absolute Ni abundances toward the outer Galaxy. For [Ni/Fe], Myers et al. (2022) report a flatter value of −0.004 ± 0.002 dex/kpc, while Magrini et al. (2023) also find a flat trend (0.002 ± 0.010 dex/kpc). Carbajo-Hijarrubia et al. (2024) find a value of −0.003 ± 0.002 dex/kpc. The negative gradient in our data, while still modest, could point to subtle variations in the nucleosynthetic processes that govern Ni and Fe production across the disk.
In summary, the trends for [V/Fe], [Cr/Fe], [Mn/Fe], [Co/Fe], and [Ni/Fe] as a function of Rgc are mostly flat or show only weak gradients, in broad agreement with the bulk of recent literature. Small discrepancies and scatter between studies may be attributed to sample selection, measurement uncertainties, and the complex nucleosynthetic histories of the Fe-peak elements. Nevertheless, the overall chemical homogeneity of these ratios across the disk is clear, reinforcing the idea of efficient mixing in the interstellar medium and similar SN enrichment histories for Fe-peak elements.
4.6 Neutron-capture elements (Cu, Zn, Y, Ce, Nd, and Yb)
As their name suggests, neutron-capture elements are formed through the capture of neutrons by atomic nuclei. This occurs via two primary processes distinguished by timescales: the slow (s-) process and the rapid (r-) process. The s process occurs when neutron captures happen on timescales longer than the β-decay lifetimes of unstable nuclei. This process predominantly takes place in AGB stars and, to a lesser extent, in massive stars (Lugaro et al. 2023). In contrast, the r process occurs in environments with a high density of free neutrons, allowing for rapid neutron captures before beta decay can occur. CCSNe and neutron star mergers (NSMs) are the main sites proposed for the r process (Cowan et al. 2021). In reality, most neutron-capture elements are produced by a combination of both s and r processes, though the dominant contributor varies by element.
Cu and Zn differ from the other investigated neutron-capture elements in that they are produced via the weak s process in massive stars. Additionally, Cu differs from Zn in its nucleosynthetic origin: Cu is produced partly through the weak s process in massive stars, but a significant fraction also originates in CCSNe (e.g., Pignatari et al. 2010). Zn, on the other hand, has only a minor weak s-process contribution; its production is dominated by explosive nucleosynthesis in CCSNe and hypernovae (e.g., Raiteri et al. 1991; Limongi & Chieffi 2003). This distinction underlines the role of Cu as a weak s-process element, whereas Zn is better described as a “transition element” bridging the iron-peak and neutron-capture regimes.
Y and Ce, on the other hand, are primarily produced via the main s process in AGB stars, while Nd is also largely of s process origin, though with some r-process contribution (Bisterzo et al. 2014; Prantzos et al. 2020). Finally, Yb has a roughly 50-50 s- to r-process contribution, making it the element with the highest r-process fraction in this study (Bisterzo et al. 2014; Prantzos et al. 2020; Kobayashi et al. 2020).
Copper: Cu abundances were determined using two H-band lines at 16 005.64 Å and 16 006.44 Å. All sample stars were included in the analysis, and NLTE synthesis was applied to both Cu lines used, but a LTE synthesis would only render 0.01 dex lower [Cu/Fe] on average. The [Cu/Fe] ratios show a flat trend with Rgc, with a best-fit slope of 0.004 ± 0.018 dex/kpc. In contrast, [Cu/H] displays a negative gradient, with a best-fit slope of −0.068 ± 0.024 dex/kpc, indicating increasing Cu enrichment toward the inner Galaxy. Gaia-ESO and OCCASO report a flat [Cu/Fe] trend and a slightly negative [Cu/H] trend which is consistent with our values (Magrini et al. 2023; Carbajo-Hijarrubia et al. 2024).
Zinc: in our work, Zn abundances were derived using a single H-band spectral line at 16 505.18 Å. As only one line was used, the derived abundances are subject to larger uncertainties. Additionally, 47 stars were excluded from the Zn analysis due to poor line quality or unreliable measurements. The [Zn/Fe] and [Zn/H] ratios exhibit a declining trend with increasing [Fe/H], consistent with findings from previous studies such as Nandakumar et al. (2024). In contrast, both [Zn/Fe] and [Zn/H] show positive gradients with Rgc, indicating higher Zn enrichment in the outer regions of the Galaxy. The best-fit slope for [Zn/Fe] versus Rgc is 0.050 ± 0.052 dex/kpc, and for [Zn/H] versus Rgc it is −0.021 ± 0.049 dex/kpc.
Yttrium: Y abundances were derived using two IR lines at 21260.45 and 22 543.84 Å. 44 stars were removed from the sample due to lines being too weak. The [Y/Fe] ratios exhibit a slight positive but statistically uncertain trend with Rgc, with a best-fit slope of 0.007 ± 0.029 dex/kpc. Meanwhile, [Y/H] shows a slightly negative distribution across Rgc, with a slope of −0.006 ± 0.038 dex/kpc. Gaia-ESO reports an age-dependent trend in Y abundances, with [Y/Fe] increasing in younger clusters and [Y/H] exhibiting a negative slope with age. OCCASO reports a [Y/Fe] value of 0.011 ± 0.004 dex/kpc which is in good agreement with our value.
Cerium: Ce abundances were determined using two H-band lines at 15 977.12 and 16 595.18 Å. The two stars UBC141_1 and NGC_2548_4 were excluded, as these Ce-lines were not detectable due to low S/Ns. Our Ce abundances were compared with those from Myers et al. (2022), showing good agreement between the two datasets. The [Ce/Fe] ratios exhibit a mild positive trend with Rgc, with a best-fit slope of 0.021 ± 0.028 dex/kpc. In contrast, [Ce/H] shows a slight negative trend, with a slope of −0.026 ± 0.021 dex/kpc, indicating a modest decline in absolute Ce abundances toward the outer Galaxy. This is also consistent with our previous studies, within the combined uncertainties (see; Bijavara Seshashayana et al. 2024a; Bijavara Seshashayana et al. 2024b). Our measured slope is consistent, within uncertainties, with the recent result by Myers et al. (2022), who find a slope of 0.022 ± 0.006 dex/kpc and by Magrini et al. (2009) (Gaia-ESO) who reported a flat trend for [Ce/Fe]. Carbajo-Hijarrubia et al. (2024) reports a value of 0.027 ± 0.009 for inner and 0.006 ± 0.012 for outer regions of the galaxy which is consistent with our value. These findings indicate that the [Ce/Fe] ratio does not vary strongly with Rgc, at least within the current measurement precision. The lack of a clear radial gradient could reflect the slow and widespread enrichment of the disk by the s process, but it might also be due to the limited number of OCs with well-determined n-capture abundances.
Neodynium: Nd abundances were determined using four H-band lines as shown in the Table B.1. The three stars NGC 2509_18, UPK85_2, and Berkeley_32_2 were excluded due to Nd II lines being too weak. The [Nd/Fe] ratios show a slight positive trend with Rgc, with a best-fit slope of 0.035± 0.019 dex/kpc. Conversely, [Nd/H] shows a negative trend with Rgc, with a slope of −0.021 ± 0.021 dex/kpc, suggesting increasing Nd enrichment toward the inner regions of the Galaxy which is consistent with Gaia-ESO (Magrini et al. 2023). The [Nd/H] trends reported by Carbajo-Hijarrubia et al. (2024) are 0.049 ± 0.009 dex/kpc (inner) 0.016 ± 0.016 dex/kpc (outer) which is consistent within uncertainties when compared with our sample.
Ytterbium: Yb abundances were derived using the H-band line at 16 498.40 Å. Several stars - UBC141_1, NGC 2509_18, Tombaugh_5_2, NGC_2548_4, NGC_2548_1, Berkeley_32_2, King11_7, and UBC577_2 - were excluded from the Yb analysis due to poor line quality or unreliable measurements. The [Yb/Fe] ratios show a positive trend with Rgc, with a best-fit slope of 0.065 ± 0.031 dex/kpc. In contrast, [Yb/H] decreases with Rgc, with a slope of 0.023 ± 0.033 dex/kpc, indicating a lesser Yb enrichment toward the inner Galaxy.
In summary, our results demonstrate that n-capture elements show only mild or negligible radial gradients across the Galactic disk, consistent with the most recent literature. Investigating radial abundance gradients of n-capture elements in the Galactic disk remains challenging due to the relatively large uncertainties typically associated with their abundance determinations. In contrast to the well-studied α- and Fe-peak elements, the distribution and evolution of n-capture elements hence remain less well understood. An additional source of uncertainty is the fact that these abundances are sensitive to a wide variety of astrophysical sites and timescales, including AGB stars and NSMs, resulting in greater intrinsic scatter, which makes it difficult to establish robust Galactic trends. As more homogeneous and larger samples become available in the future, it may be possible to clarify whether subtle gradients exist for n-capture elements and what those trends reveal about the timescales and sources of their nucleosynthesis in the Milky Way.
5 Summary and conclusions
Trends of elemental abundances with Galactocentric radius reveal distinct behaviors across different nucleosynthetic groups, providing a window into the history and processes shaping the Galactic disk. Among the α elements, magnesium, silicon, calcium, and titanium exhibit essentially flat [X/Fe] trends as a function of Rgc, indicating a uniform enrichment relative to iron across the disk. Conversely, the [X/H] gradients exhibited by these star clusters are negative, thereby reflecting the well-established metallicity gradient that is characterized by a decrease in absolute abundances toward the outer regions of the Galaxy. Sulfur and fluorine demonstrate comparable behaviors; however, their [X/H] slopes are closer to zero or even slightly positive in some cases, suggesting the presence of additional complexity in their production channels or the possibility of sample effects.
In the case of the odd-Z elements, sodium and aluminium, there is evidence of flat or mildly negative [X/Fe] gradients and clear negative slopes in [X/H]. This finding indicates that while their relative production compared to iron remains stable, their absolute abundances are indicative of the overall metal-licity decline with increasing Rgc. Potassium exhibits chemical homogeneity in both [X/Fe] and [X/H], with only marginal or statistically insignificant trends, consistent with its less certain nucleosynthetic origins.
Within the iron-peak group, elements such as, vanadium, chromium, manganese, cobalt, and nickel all display remarkably flat [X/Fe] profiles with respect to Rgc, reaffirming the hypothesis that their production is closely linked to that of iron itself-most likely through a combination of Type Ia and corecollapse supernovae. Of particular interest is the observation that copper exhibits a flat [Cu/Fe] trend, yet a positive [Cu/H] gradient. This phenomenon may be indicative of local enrichment or the presence of distinct nucleosynthetic contributors. The neutron-capture elements (yttrium, cerium, neodymium, and ytterbium) have been observed to exhibit flat or mildly positive [X/Fe] gradients with Rgc, and typically flat or negative [X/H] slopes. These trends are likely to reflect the diverse nucle-osynthetic sources for these species, such as the s process in AGB stars and the r process in NSMs, whereby the former act over longer timescales than those for lighter elements. The trend of [Yb/Fe] has been explored for the first time, providing novel constraints.
The trans-iron element, zinc, is of particular interest, as it demonstrates positive slopes in both [Zn/Fe] and [Zn/H]. This suggests the potential for a distinct or more efficient production channel for Zn at larger Rgc, which may be linked to hypernovae or metallicity-dependent yields from massive stars.
A detailed comparison with values from the literature shows that, while our results are broadly consistent with recent optical and infrared studies within uncertainties, our analysis offers improved precision and homogeneity. This is especially evident for elements such as fluorine and potassium that are challenging to measure in the optical domain, where our high-resolution infrared approach provides more reliable abundance determinations. The enhanced internal consistency and reduced scatter across the dataset demonstrate the robustness of the methodology and underscore the advantages of a uniform, infrared-based analysis for studying OC chemistry.
Finally, this work highlights the critical role of OCs as tracers of Galactic chemical evolution. As young, coeval stellar populations with accurately determined ages, distances and kinematics, OCs are ideal for investigating element abundance patterns across a wide range of Galactic environments. Large OC-based samples, which covers a broad spectrum of Rgc, metal-licities, and ages, enables the identification of subtle abundance gradients and the disentangling of nucleosynthetic signatures. It also allows for a nuanced assessment of the impact of different enrichment processes, including Type II and Ia supernovae, AGB stars, and neutron-capture events, on the evolution of the Milky Way. Furthermore, this study fills an important gap in the chemical cartography of the Galaxy by extending the analysis to more elements being analyzed consistently within one project, including many key odd-Z and neutron-capture elements. Our results therefore provide valuable and unique insights, furthering our understanding of the complex interplay of processes that drive Galactic chemical evolution.
Data availability
All machine readable data underlying this work are available at the CDS via https://cdsarc.cds.unistra.fr/viz-bin/cat/J/A+A/704/A220. The CDS package includes: (i) the full list of observed stars and basic properties for each OC (Appendix A); (ii) the complete atomic and molecular line list used in the analysis (Appendix B); (iii) derived stellar parameters with formal PySME uncertainties and a literature-comparison table discussed (Appendix C); and (iv) per-star abundance ratios [X/Fe] with uncertainties, cluster means and dispersions, and per-element star counts documenting sample completeness (Appendix D). All files include column descriptions and are provided in machine-readable ASCII format.
Acknowledgements
Based on observations with the Italian Telescopio Nazionale Galileo (TNG) operated on the island of La Palma by the Fundación Galileo Galilei of the INAF (Istituto Nazionale di Astrofisica) at the Spanish Observatorio del Roque de los Muchachos of the Instituto de Astrofisica de Canarias. We thank the anonymous referee for their helpful comments and suggestions that improved this paper. S.B.S. acknowledges funding from the Crafoord Foundation. H.J. acknowledges support from the Swedish Research Council, VR (grant 2024-04989). AB acknowledges support from INAF MiniGrant 2022. V.D. acknowledges financial support from the Fulbright Visiting Research Scholar 2024-2025.
References
- Alonso-Santiago, J., Frasca, A., Catanzaro, G., et al. 2021, A&A, 656, A149 [NASA ADS] [CrossRef] [EDP Sciences] [Google Scholar]
- Amarsi, A. M., Lind, K., Osorio, Y., et al. 2020, A&A, 642, A62 [EDP Sciences] [Google Scholar]
- Asplund, M., Amarsi, A. M., & Grevesse, N. 2021, A&A, 653, A141 [NASA ADS] [CrossRef] [EDP Sciences] [Google Scholar]
- Battistini, C., & Bensby, T. 2015, A&A, 577, A9 [NASA ADS] [CrossRef] [EDP Sciences] [Google Scholar]
- Bijavara Seshashayana, S., Jönsson, H., D’Orazi, V., et al. 2024a, A&A, 683, A218 [NASA ADS] [CrossRef] [EDP Sciences] [Google Scholar]
- Bijavara Seshashayana, S., Jönsson, H., D’Orazi, V., et al. 2024b, A&A, 689, A120 [NASA ADS] [CrossRef] [EDP Sciences] [Google Scholar]
- Bisterzo, S., Travaglio, C., Gallino, R., Wiescher, M., & Käppeler, F. 2014, ApJ, 787, 10 [NASA ADS] [CrossRef] [Google Scholar]
- Bossini, D., Vallenari, A., Bragaglia, A., et al. 2019, A&A, 623, A108 [NASA ADS] [CrossRef] [EDP Sciences] [Google Scholar]
- Bragaglia, A., & Tosi, M. 2006, in Chemical Abundances and Mixing in Stars in the Milky Way and its Satellites, eds. S. Randich, & L. Pasquini (Berlin: Springer), 9 [Google Scholar]
- Brogaard, K., Grundahl, F., Sandquist, E. L., et al. 2021, A&A, 649, A178 [NASA ADS] [CrossRef] [EDP Sciences] [Google Scholar]
- Brooke, J. S. A., Bernath, P. F., Western, C. M., et al. 2016, J. Quant. Spec. Radiat. Transf., 168, 142 [NASA ADS] [CrossRef] [Google Scholar]
- Caliskan, S., Amarsi, A. M., Racca, M., et al. 2025, A&A, 696, A210 [NASA ADS] [CrossRef] [EDP Sciences] [Google Scholar]
- Cantat-Gaudin, T., Anders, F., Castro-Ginard, A., et al. 2020, A&A, 640, A1 [NASA ADS] [CrossRef] [EDP Sciences] [Google Scholar]
- Carbajo-Hijarrubia, J., Casamiquela, L., Carrera, R., et al. 2024, A&A, 687, A239 [NASA ADS] [CrossRef] [EDP Sciences] [Google Scholar]
- Cardelli, J. A., Clayton, G. C., & Mathis, J. S. 1989, ApJ, 345, 245 [Google Scholar]
- Carrera, R., Casamiquela, L., Bragaglia, A., et al. 2022, A&A, 663, A148 [NASA ADS] [CrossRef] [EDP Sciences] [Google Scholar]
- Casagrande, L., & VandenBerg, D. A. 2018a, MNRAS, 479, L102 [NASA ADS] [CrossRef] [Google Scholar]
- Casagrande, L., & VandenBerg, D. A. 2018b, MNRAS, 475, 5023 [Google Scholar]
- Casali, G., Magrini, L., Frasca, A., et al. 2020, A&A, 643, A12 [NASA ADS] [CrossRef] [EDP Sciences] [Google Scholar]
- Casamiquela, L., Carrera, R., Blanco-Cuaresma, S., et al. 2017, MNRAS, 470, 4363 [NASA ADS] [CrossRef] [Google Scholar]
- Casamiquela, L., Blanco-Cuaresma, S., Carrera, R., et al. 2019, MNRAS, 490, 1821 [NASA ADS] [CrossRef] [Google Scholar]
- Choi, J., Dotter, A., Conroy, C., et al. 2016, ApJ, 823, 102 [Google Scholar]
- Claudi, R., Benatti, S., Carleo, I., et al. 2017, Eur. Phys. J. Plus, 132, 364 [NASA ADS] [CrossRef] [Google Scholar]
- Cosentino, R., Lovis, C., Pepe, F., et al. 2014, SPIE Conf. Ser., 9147, 91478C [Google Scholar]
- Cowan, J. J., Sneden, C., Lawler, J. E., et al. 2021, Rev. Mod. Phys., 93, 015002 [Google Scholar]
- da Silva, R., D’Orazi, V., Palla, M., et al. 2023, A&A, 678, A195 [NASA ADS] [CrossRef] [EDP Sciences] [Google Scholar]
- Dal Ponte, M., D’Orazi, V., Bragaglia, A., et al. 2025, A&A, 701, A289 [NASA ADS] [CrossRef] [EDP Sciences] [Google Scholar]
- de los Reyes, M. A. C., Kirby, E. N., Seitenzahl, I. R., & Shen, K. J. 2020, ApJ, 891, 85 [NASA ADS] [CrossRef] [Google Scholar]
- Donor, J., Frinchaboy, P. M., Cunha, K., et al. 2020, AJ, 159, 199 [NASA ADS] [CrossRef] [Google Scholar]
- D’Orazi, V., Oliva, E., Bragaglia, A., et al. 2020, A&A, 633, A38 [NASA ADS] [CrossRef] [EDP Sciences] [Google Scholar]
- Dotter, A. 2016, ApJS, 222, 8 [Google Scholar]
- Frasca, A., Alonso-Santiago, J., Catanzaro, G., et al. 2019, A&A, 632, A16 [NASA ADS] [EDP Sciences] [Google Scholar]
- Gratton, R., Bragaglia, A., Carretta, E., & Tosi, M. 2006, ApJ, 642, 462 [NASA ADS] [CrossRef] [Google Scholar]
- Gustafsson, B., Edvardsson, B., Eriksson, K., et al. 2008, A&A, 486, 951 [NASA ADS] [CrossRef] [EDP Sciences] [Google Scholar]
- Hu, Q., & Soubiran, C. 2025, A&A, 699, A246 [NASA ADS] [CrossRef] [EDP Sciences] [Google Scholar]
- Hunt, E. L., & Reffert, S. 2023, A&A, 673, A114 [NASA ADS] [CrossRef] [EDP Sciences] [Google Scholar]
- Iben, Jr., I., & Tutukov, A. V. 1984, ApJS, 54, 335 [NASA ADS] [CrossRef] [Google Scholar]
- Iwamoto, K., Brachwitz, F., Nomoto, K., et al. 1999, ApJS, 125, 439 [NASA ADS] [CrossRef] [Google Scholar]
- Jílková, L., Carraro, G., Jungwiert, B., & Minchev, I. 2012, A&A, 541, A64 [Google Scholar]
- Kobayashi, C., Umeda, H., Nomoto, K., Tominaga, N., & Ohkubo, T. 2006, ApJ, 653, 1145 [NASA ADS] [CrossRef] [Google Scholar]
- Kobayashi, C., Karakas, A. I., & Umeda, H. 2011, MNRAS, 414, 3231 [Google Scholar]
- Kobayashi, C., Leung, S.-C., & Nomoto, K. 2020, ApJ, 895, 138 [CrossRef] [Google Scholar]
- Kupka, F. G., Ryabchikova, T. A., Piskunov, N. E., Stempels, H. C., & Weiss, W. W. 2000, Balt. Astron., 9, 590 [Google Scholar]
- Li, G., Gordon, I. E., Rothman, L. S., et al. 2015, ApJ, 216, 15 [Google Scholar]
- Limongi, M., & Chieffi, A. 2003, ApJ, 592, 404 [CrossRef] [Google Scholar]
- Lomaeva, M., Jönsson, H., Ryde, N., Schultheis, M., & Thorsbro, B. 2019, A&A, 625, A141 [NASA ADS] [CrossRef] [EDP Sciences] [Google Scholar]
- Lugaro, M., Pignatari, M., Reifarth, R., & Wiescher, M. 2023, Annual Rev. Nucl. Part. Sci., 73, 315 [Google Scholar]
- Magrini, L., Sestito, P., Randich, S., & Galli, D. 2009, A&A, 494, 95 [NASA ADS] [CrossRef] [EDP Sciences] [Google Scholar]
- Magrini, L., Romano, D., Randich, S., et al. 2023, A&A, 670, A122 [NASA ADS] [CrossRef] [EDP Sciences] [Google Scholar]
- Majewski, S. R., Schiavon, R. P., Frinchaboy, P. M., et al. 2017, AJ, 154, 94 [NASA ADS] [CrossRef] [Google Scholar]
- Mallinson, J. W. E., Lind, K., Amarsi, A. M., & Youakim, K. 2024, A&A, 687, A5 [NASA ADS] [CrossRef] [EDP Sciences] [Google Scholar]
- Matteucci, F. 2001, Astrophys. Space Sci. Lib., 253 [Google Scholar]
- Matteucci, F., & Greggio, L. 1986, ASI Ser. C, 163, 315 [Google Scholar]
- Montelius, M., Forsberg, R., Ryde, N., et al. 2022, A&A, 665, A135 [NASA ADS] [CrossRef] [EDP Sciences] [Google Scholar]
- Myers, N., Donor, J., Spoo, T., et al. 2022, AJ, 164, 85 [NASA ADS] [CrossRef] [Google Scholar]
- Nandakumar, G., Ryde, N., Casagrande, L., & Mace, G. 2023a, A&A, 675, A23 [NASA ADS] [CrossRef] [EDP Sciences] [Google Scholar]
- Nandakumar, G., Ryde, N., & Mace, G. 2023b, A&A, 676, A79 [NASA ADS] [CrossRef] [EDP Sciences] [Google Scholar]
- Nandakumar, G., Ryde, N., Forsberg, R., et al. 2024, A&A, 684, A15 [NASA ADS] [CrossRef] [EDP Sciences] [Google Scholar]
- Nomoto, K., & Leung, S.-C. 2018, Space Sci. Rev., 214, 67 [NASA ADS] [CrossRef] [Google Scholar]
- Nomoto, K., Kobayashi, C., & Tominaga, N. 2013, Ann. Rev. Astron. Astrophys., 51, 457 [Google Scholar]
- Oliva, E., Biliotti, V., & Baffa, C., et al. 2012a, Proc. SPIE, 8453, 84532T [NASA ADS] [CrossRef] [Google Scholar]
- Oliva, E., Origlia, L., & Maiolino, R., et al. 2012b, Proc. SPIE, 8446, 84463T [NASA ADS] [CrossRef] [Google Scholar]
- Origlia, L., Oliva, E., Baffa, C., et al., 2014, Proc. SPIE, 9147, 91471E [Google Scholar]
- Paxton, B., Marchant, P., Schwab, J., et al. 2015, ApJS, 220, 15 [Google Scholar]
- Pignatari, M., Gallino, R., Heil, M., et al. 2010, ApJ, 710, 1557 [Google Scholar]
- Piskunov, N., & Valenti, J. A. 2017, A&A, 597, A16 [NASA ADS] [CrossRef] [EDP Sciences] [Google Scholar]
- Piskunov, N. E., Kupka, F., Ryabchikova, T. A., Weiss, W. W., & Jeffery, C. S. 1995, A&AS, 112, 525 [Google Scholar]
- Prantzos, N., Abia, C., Limongi, M., Chieffi, A., & Cristallo, S. 2018, MNRAS, 476, 3432 [Google Scholar]
- Prantzos, N., Abia, C., Cristallo, S., Limongi, M., & Chieffi, A. 2020, MNRAS, 491, 1832 [Google Scholar]
- Raiteri, C. M., Gallino, R., Busso, M., Neuberger, D., & Käppeler, F. 1991, ApJ, 371, 665 [NASA ADS] [CrossRef] [Google Scholar]
- Rainer, M., Harutyunyan, A., Carleo, I., et al. 2018, SPIE Conf. Ser., 10702, 1070266 [Google Scholar]
- Randich, S., Gilmore, G., Magrini, L., et al. 2022, A&A, 666, A121 [NASA ADS] [CrossRef] [EDP Sciences] [Google Scholar]
- Recio-Blanco, A., de Laverny, P., Palicio, P. A., et al. 2023, A&A, 674, A29 [NASA ADS] [CrossRef] [EDP Sciences] [Google Scholar]
- Reddy, A. B. S., Lambert, D. L., & Giridhar, S. 2016, MNRAS, 463, 4366 [NASA ADS] [CrossRef] [Google Scholar]
- Romano, D., Karakas, A. I., Tosi, M., & Matteucci, F. 2010, A&A, 522, A32 [NASA ADS] [CrossRef] [EDP Sciences] [Google Scholar]
- Ryabchikova, T., Piskunov, N., Kurucz, R. L., et al. 2015, Phys. Scrip., 90, 054005 [NASA ADS] [CrossRef] [Google Scholar]
- Smiljanic, R., Romano, D., Bragaglia, A., et al. 2016, A&A, 589, A115 [NASA ADS] [CrossRef] [EDP Sciences] [Google Scholar]
- Sneden, C., Lucatello, S., Ram, R. S., Brooke, J. S. A., & Bernath, P. 2014, ApJS, 214, 26 [Google Scholar]
- Spina, L., Ting, Y. S., De Silva, G. M., et al. 2021, MNRAS, 503, 3279 [CrossRef] [Google Scholar]
- Tinsley, B. M. 1980, in Texas Workshop on Type I Supernovae, ed. J. C. Wheeler, 196 [Google Scholar]
- Trentin, E., Catanzaro, G., Ripepi, V., et al. 2024, A&A, 690, A246 [NASA ADS] [CrossRef] [EDP Sciences] [Google Scholar]
- Vasini, A., Spitoni, E., & Matteucci, F. 2024, A&A, 683, A121 [NASA ADS] [CrossRef] [EDP Sciences] [Google Scholar]
- Viscasillas Vázquez, C., Magrini, L., Casali, G., et al. 2022, A&A, 665, A88 [CrossRef] [EDP Sciences] [Google Scholar]
- Wehrhahn, A., Piskunov, N., & Ryabchikova, T. 2023, A&A, 671, A171 [NASA ADS] [CrossRef] [EDP Sciences] [Google Scholar]
- Whelan, J., & Iben, Jr., I. 1973, ApJ, 186, 1007 [CrossRef] [Google Scholar]
- Woosley, S. E., & Weaver, T. A. 1995, ApJS, 101, 181 [Google Scholar]
- Zasowski, G., Schultheis, M., Hasselquist, S., et al. 2019, ApJ, 870, 138 [NASA ADS] [CrossRef] [Google Scholar]
- Zhang, R., Lucatello, S., Bragaglia, A., et al. 2021, A&A, 654, A77 [NASA ADS] [CrossRef] [EDP Sciences] [Google Scholar]
- Zhang, R., Lucatello, S., Bragaglia, A., et al. 2022, A&A, 667, A103 [NASA ADS] [CrossRef] [EDP Sciences] [Google Scholar]
Appendix A Overview of observed clusters and stars
All appendix tables are available in electronic form at the CDS.
Table A.1: The following table provides general information for the stars analyzed in each stellar cluster, including the Gaia DR3 source ID, equatorial coordinates, and G-band magnitude. The ages, Av, and Rgc are from Cantat-Gaudin et al. (2020) for all clusters except for NGC 6791 which is from Brogaard et al. (2021). The clusters are arranged in ascending order of age.
Appendix B Atomic and molecular data
Table B.1: Spectral line data of molecular (OH, CO, CN, HF) and atomic (Fe I, Mg I, Si I, Ti I/II, S I, Ca I, Na I, Al I, K I, V I, Cr I, Mn I, Co I, Ni I, Cu I, Zn I, Y I, Ce II, Nd II, Yb I) lines used in determining stellar parameters and elemental abundances. log(gf)-values are from Brooke et al. (2016) for OH, Li et al. (2015) for CO, Sneden et al. (2014) for CN. For all other lines, we used updated VALD data (Piskunov et al. 1995; Kupka et al. 2000; Ryabchikova et al. 2015) with astrophysical calibrations based on solar and Arcturus spectra (Montelius et al. 2022; Nandakumar et al. 2023a,b, 2024).
Appendix C Stellar parameters
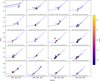 |
Fig. C.1 Kiel diagrams showing Teff, log g, and [Fe/H] of stars in different clusters together with the corresponding MIST isochrones. Each panel corresponds to a different open cluster, with its name, age, and mean [Fe/H]. Optical data from Dal Ponte et al. (2025) are shown as black points. |
Table C.1: Stellar parameters Teff , log g, [Fe/H], vmic, vmac, [C/Fe], [N/Fe], and [O/Fe] for the sample stars in this work along with their formal PySME fit uncertainties.
Table C.2: Comparison of the stellar parameters Teff , log g and [Fe/H] for the sample stars in this work and literature values for the same stars. Differences are (this work-literature). Uncertainties are standard deviations for each cluster.
Appendix D Abundances
Table D.1: The number of stars in each cluster for which a given element was possible to determine. Individual stars were excluded if the spectral line was not detected or of poor quality (low S/N). The final row provides the total number of stars per element across all clusters.
Table D.2: [X/Fe] of all our individual sample stars.
Table D.3: Similar to the table D.2 but for the remaining elements.
Table D.4: Mean [Fe/H], [Mg/Fe], [Si/Fe], [S/Fe], [Ca/Fe], [F/Fe], [Na/Fe], [Al/Fe], and [K/Fe] for the clusters in our sample.
Table D.5: Mean [Ti/Fe], [V/Fe], [Cr/Fe], [Mn/Fe], [Co/Fe], and [Ni/Fe] for the clusters in our sample.
Table D.6: Mean [Cu/Fe], [Zn/Fe], [Y/Fe], [Ce/Fe], [Nd/Fe], and [Yb/Fe] for the clusters in our sample.
All Tables
Comparison of Galactic abundance gradients (slopes in dex/kpc) for [X/H] vs. Rgc from this work and selected literature sources.
All Figures
|
Fig. 1 Mean cluster abundance ratios as a function of [Fe/H]. The black markers are from the present work, with the black star indicating the OC NGC 6791. The red squares are from Dal Ponte et al. (2025), and orange triangles are from Myers et al. (2022) for all elements but F. For F, red squares are from Bijavara Seshashayana et al. (2024a); Bijavara Seshashayana et al. (2024b), orange triangles are all other literature OCs with determined F abundances (for more information, see Bijavara Seshashayana et al. 2024a; Bijavara Seshashayana et al. 2024b). |
| In the text | |
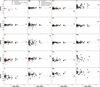 |
Fig. 2 Same as Figure 1 but here [X/Fe] values are plotted against age. |
| In the text | |
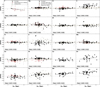 |
Fig. 3 Same as Figure 1 but here [X/Fe] values are plotted against Rgc. |
| In the text | |
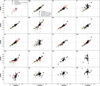 |
Fig. 4 Abundance [X/H] ratios as a function of [Fe/H]. Symbols are as in Figure 1. |
| In the text | |
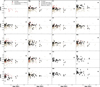 |
Fig. 5 Same as Figure 4 but here [X/H] values are plotted against age. |
| In the text | |
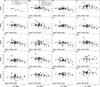 |
Fig. 6 Same as the Figure 4 but here [X/H] values are plotted against Rgc. |
| In the text | |
|
Fig. 7 [Fe/H] vs. Rgc for our clusters. Each point is color-coded according to cluster age (in Gyr), as indicated by the color bar. The red line indicates the linear fit, with the exclusion of NGC 6791 (denoted by a star symbol). The derived slope and its uncertainty are indicated in the legend. |
| In the text | |
|
Fig. C.1 Kiel diagrams showing Teff, log g, and [Fe/H] of stars in different clusters together with the corresponding MIST isochrones. Each panel corresponds to a different open cluster, with its name, age, and mean [Fe/H]. Optical data from Dal Ponte et al. (2025) are shown as black points. |
| In the text | |
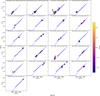 |
Fig. C.2 Same as Fig. C.1, for the remaining clusters. |
| In the text | |
Current usage metrics show cumulative count of Article Views (full-text article views including HTML views, PDF and ePub downloads, according to the available data) and Abstracts Views on Vision4Press platform.
Data correspond to usage on the plateform after 2015. The current usage metrics is available 48-96 hours after online publication and is updated daily on week days.
Initial download of the metrics may take a while.