Fig. 10.
Download original image
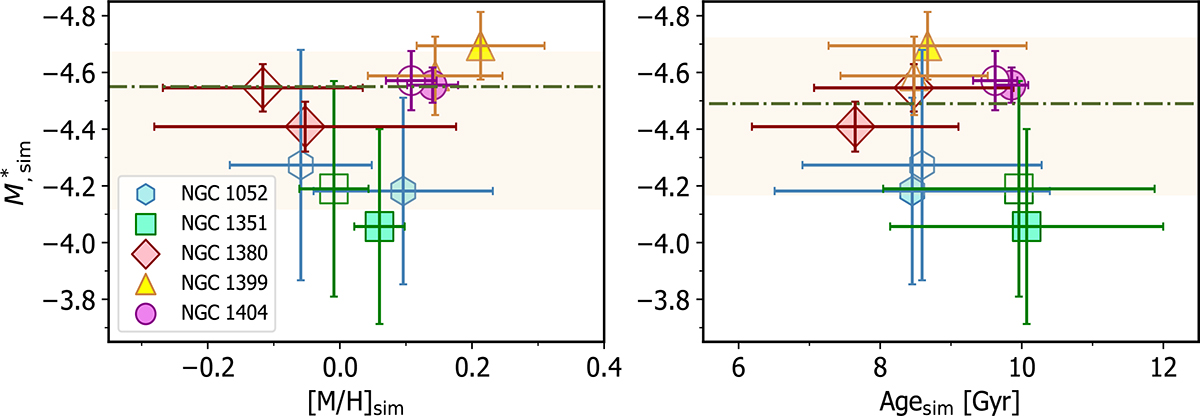
M* from our simulation analogues as a function of total metallicity (left) and age (right). The dot-dashed lines indicate the weighted average. The solid and open markers represent the inner and outer annuli, respectively. The highlights illustrate the standard deviation. We note that the x- and y-axis ranges are different to those in Fig. 9.
Current usage metrics show cumulative count of Article Views (full-text article views including HTML views, PDF and ePub downloads, according to the available data) and Abstracts Views on Vision4Press platform.
Data correspond to usage on the plateform after 2015. The current usage metrics is available 48-96 hours after online publication and is updated daily on week days.
Initial download of the metrics may take a while.