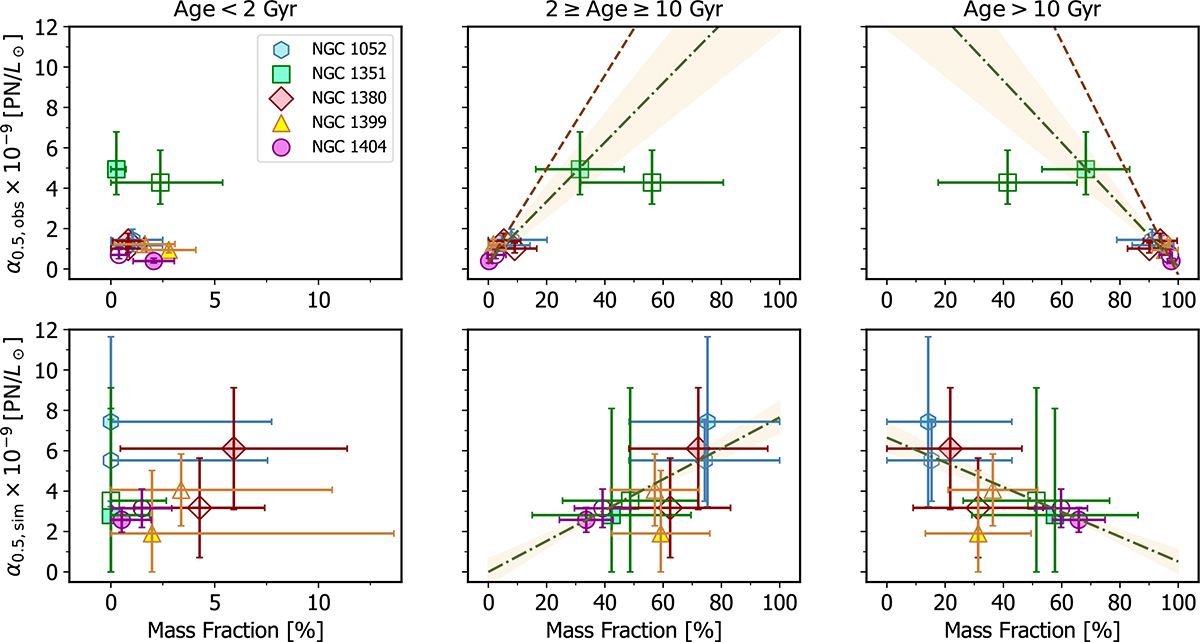
Fig. 12.
Download original image
Galaxy α0.5 values as a function of the mass fraction of young (Age < 2 Gyr), intermediate (2 ≥ Age ≥ 10 Gyr), and old (Age > 10 Gyr) stars. Upper panels: Observations. Lower panels: Values from the simulations. The green dot-dashed lines show the best-fit regressions; fits that exclude the observational data for NGC 1351 are shown as a brown dashed line.
Current usage metrics show cumulative count of Article Views (full-text article views including HTML views, PDF and ePub downloads, according to the available data) and Abstracts Views on Vision4Press platform.
Data correspond to usage on the plateform after 2015. The current usage metrics is available 48-96 hours after online publication and is updated daily on week days.
Initial download of the metrics may take a while.