Open Access
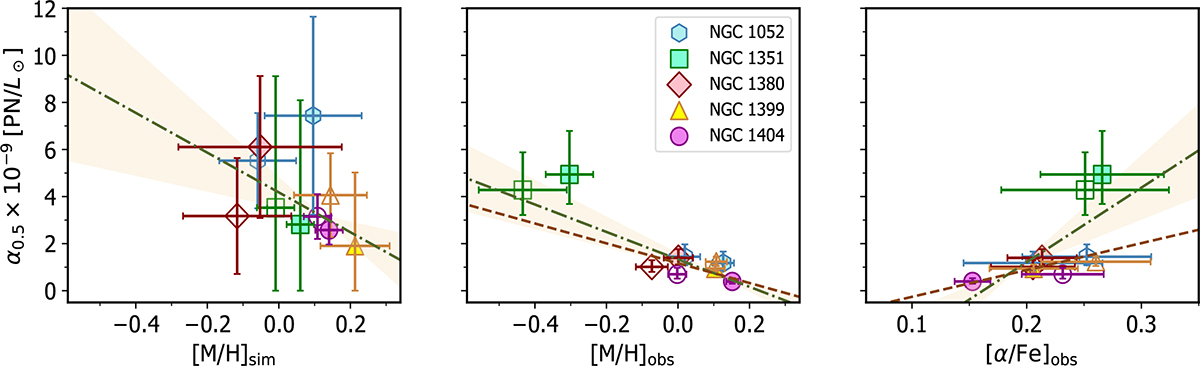
Fig. 13.
Download original image
Left and middle: Our α0.5 measurements as a function of [M/H] for the simulations and observations, respectively. Right: Our calculated [α/Fe] values for the observations. The green dot-dashed lines show our best fit regressions; fits that exclude NGC 1351 are denoted by the dashed brown line.
Current usage metrics show cumulative count of Article Views (full-text article views including HTML views, PDF and ePub downloads, according to the available data) and Abstracts Views on Vision4Press platform.
Data correspond to usage on the plateform after 2015. The current usage metrics is available 48-96 hours after online publication and is updated daily on week days.
Initial download of the metrics may take a while.